Congress Avenue Mile
Saturday, May 20, 2006 - Austin TX
Results from DoitSports.com, by run-far.com - Road Mile, slightly downhill, slight headwind
What is it??? - Event Information - Event Site
Girls Results - Boys Results - Boys Team Scores - Girls Team Scores
A Road Mile for Elite Milers in Texas - Report from South Region Editor John Sullivan
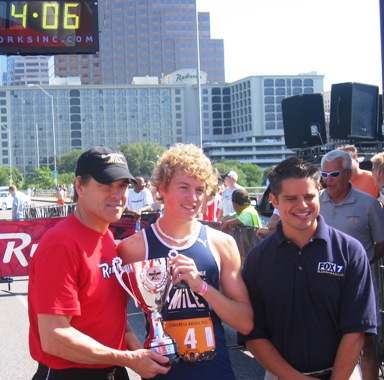
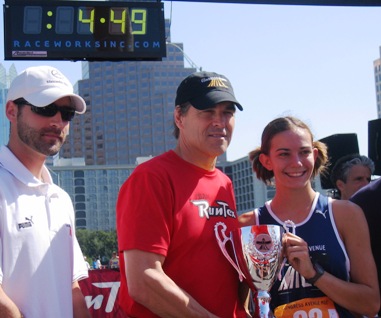
A&M Consolidated TX jr Duncan Phillips 4:06.70 - Paradise sr Lauren Hodges 4:49.90
Boys
A&M Consolidated jr Duncan Phillips, the state 5A 1600 winner and Foot Locker finalist last fall, blazed a 4:06.70 to nab top honors. The Woodlands sr Daniel Gerber, a fellow Foot Locker finalist, had the lead until the last 150 and garnered 2nd in 4:09.85. Young gun Cy-Falls soph Blake Shaw, a 4-sport athlete, had a strong kick to grab 3rd in 4:10.40 justr ahead of El Paso Andress jr Wes Walker in 4:10.60. Ft Worth North Side sr Armando Saldivar captured 5th in 4:11.10 followed by 43 others.
Girls
Paradise sr Loren Hodges finished with a flurry to win the 1st ever Elite High School race at the annual Congress Avenue Mile. Loren, the state 2A 1600 and 800 champ to go along with the Texas Relays 1600 title (4:55.45) and an undefeated track season, ran a stellar 4:49.90 to move past Richardson jr Jillian Rosen in the final 50 meters. Jillian held on for silver in 4:50.05 followed by Cy Creek jr Allison Pye in 4:53.60, The Woodlands sr Cheryl Spring in 4:55.50, Hereford sr Betzy Jimenez in 4:55.90, Kingwood sr Danielle Selner in 4:56.00 and 39 others. The course is slightly downhill, but there was also a headwind
|
|
|---|---|
| Congress Avenue Mile winners Duncan Phillips (left) and Loren Hodges accept trophies from Texas Governor Rick Perry. |
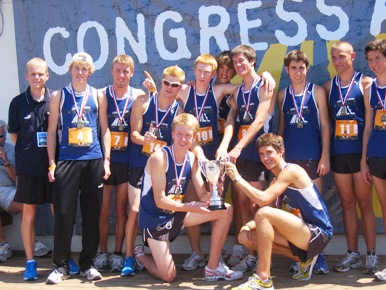
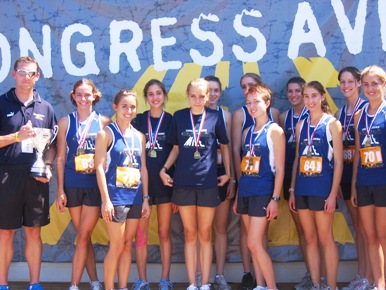
Pictured below, the winning North boys and North girls
 |
 |
|---|
Congress Avenue Mile 2006Final Team ResultsMay 20, 2006Results By RunFAR; www.run-far.com
| Class - Boys | ||||||||
| High Schoolers | ||||||||
| Team - NORTH | Finish Position - 1 | |||||||
| Team Score (places): 73 | Team Score (times): 29:38.40 | Ave Time:04:14.06 | ||||||
Bib No |
Name |
|
O'All Place |
Cum Place |
Time |
Cum Time |
Time Back |
|
1 |
4 |
Duncan Phillips |
|
1 |
1 |
04:06.70 |
04:06.70 |
00:00.00 |
2 |
6 |
Daniel Gerber |
|
2 |
3 |
04:09.85 |
08:16.55 |
00:03.15 |
3 |
5 |
Chris Harkins |
|
10 |
13 |
04:15.00 |
12:31.55 |
00:08.30 |
4 |
9 |
Alex Neff |
|
11 |
24 |
04:15.60 |
16:47.15 |
00:08.90 |
5 |
11 |
Ryan Lusk |
|
14 |
38 |
04:16.15 |
21:03.30 |
00:09.45 |
6 |
15 |
Elliott Starcevich |
|
16 |
54 |
04:17.10 |
25:20.40 |
00:10.40 |
7 |
7 |
Dusty Langwell |
|
19 |
73 |
04:18.00 |
29:38.40 |
00:11.30 |
8 |
13 |
Patrick Todd |
|
20 |
93 |
04:19.30 |
33:57.70 |
00:12.60 |
9 |
8 |
Will Smith |
|
22 |
115 |
04:20.00 |
38:17.70 |
00:13.30 |
10 |
10 |
Will Fairhurst |
|
24 |
139 |
04:20.60 |
42:38.30 |
00:13.90 |
11 |
14 |
Carson Penepacker |
|
34 |
173 |
04:25.10 |
47:03.40 |
00:18.40 |
12 |
12 |
Josh Litos |
|
38 |
211 |
04:27.80 |
51:31.20 |
00:21.10 |
| Team - WEST | Finish Position - 2 | |||||||
| Team Score (places): 92 | Team Score (times): 29:49.55 | Ave Time:04:15.65 | ||||||
Bib No |
Name |
|
O'All Place |
Cum Place |
Time |
Cum Time |
Time Back |
|
1 |
24 |
Wes Walker |
|
4 |
4 |
04:10.60 |
04:10.60 |
00:00.00 |
2 |
26 |
Armando Saldivar |
|
5 |
9 |
04:11.10 |
08:21.70 |
00:00.50 |
3 |
17 |
Matt Daniels |
|
6 |
15 |
04:13.00 |
12:34.70 |
00:02.40 |
4 |
16 |
Colby Lowe |
|
13 |
28 |
04:15.90 |
16:50.60 |
00:05.30 |
5 |
21 |
Will Rodgers |
|
15 |
43 |
04:16.95 |
21:07.55 |
00:06.35 |
6 |
25 |
C J Brown |
|
17 |
60 |
04:17.30 |
25:24.85 |
00:06.70 |
7 |
20 |
Matt Ross |
|
32 |
92 |
04:24.70 |
29:49.55 |
00:14.10 |
8 |
27 |
Nathan Milles |
|
33 |
125 |
04:25.00 |
34:14.55 |
00:14.40 |
9 |
19 |
Brandon Cooper |
|
40 |
165 |
04:29.20 |
38:43.75 |
00:18.60 |
10 |
22 |
Chris Moore |
|
43 |
208 |
04:32.85 |
43:16.60 |
00:22.25 |
11 |
23 |
Drew Soucy |
|
44 |
252 |
04:36.10 |
47:52.70 |
00:25.50 |
12 |
18 |
Jake Cosby |
|
46 |
298 |
04:43.15 |
52:35.85 |
00:32.55 |
| Team - EAST | Finish Position - 3 | |||||||
| Team Score (places): 123 | Team Score (times): 30:09.10 | Ave Time:04:18.44 | ||||||
Bib No |
Name |
|
O'All Place |
Cum Place |
Time |
Cum Time |
Time Back |
|
1 |
28 |
Blake Shaw |
|
3 |
3 |
04:10.40 |
04:10.40 |
00:00.00 |
2 |
34 |
Ahmed Harb |
|
7 |
10 |
04:13.30 |
08:23.70 |
00:02.90 |
3 |
29 |
John Buck |
|
12 |
22 |
04:15.75 |
12:39.45 |
00:05.35 |
4 |
31 |
Greg Casar |
|
21 |
43 |
04:19.65 |
16:59.10 |
00:09.25 |
5 |
39 |
Luis Garza |
|
25 |
68 |
04:22.55 |
21:21.65 |
00:12.15 |
6 |
33 |
Brad Mullens |
|
26 |
94 |
04:23.05 |
25:44.70 |
00:12.65 |
7 |
32 |
Drew Bean |
|
29 |
123 |
04:24.40 |
30:09.10 |
00:14.00 |
8 |
30 |
Joe Sauvajeau |
|
30 |
153 |
04:24.45 |
34:33.55 |
00:14.05 |
9 |
38 |
Sam Hulse |
|
31 |
184 |
04:24.65 |
38:58.20 |
00:14.25 |
10 |
37 |
Dylan Roberts |
|
35 |
219 |
04:25.25 |
43:23.45 |
00:14.85 |
11 |
35 |
Ryan Snapp |
|
41 |
260 |
04:30.65 |
47:54.10 |
00:20.25 |
12 |
36 |
Bruce Myles |
|
48 |
308 |
04:54.70 |
52:48.80 |
00:44.30 |
| Team - SOUTH | Finish Position - 4 | |||||||
| Team Score (places): 149 | Team Score (times): 30:18.45 | Ave Time:04:19.78 | ||||||
Bib No |
Name |
|
O'All Place |
Cum Place |
Time |
Cum Time |
Time Back |
|
1 |
44 |
Josh Lopez |
|
8 |
8 |
04:13.55 |
04:13.55 |
00:00.00 |
2 |
47 |
Lorin Wilson |
|
9 |
17 |
04:13.85 |
08:27.40 |
00:00.30 |
3 |
51 |
Abraham Lopez |
|
18 |
35 |
04:17.70 |
12:45.10 |
00:04.15 |
4 |
49 |
Brandon Chiuminetta |
|
23 |
58 |
04:20.30 |
17:05.40 |
00:06.75 |
5 |
50 |
Alfredo Soto |
|
27 |
85 |
04:23.25 |
21:28.65 |
00:09.70 |
6 |
41 |
Omar Doria |
|
28 |
113 |
04:24.20 |
25:52.85 |
00:10.65 |
7 |
40 |
Ari Perez |
|
36 |
149 |
04:25.60 |
30:18.45 |
00:12.05 |
8 |
43 |
Wally Gonzalez |
|
37 |
186 |
04:27.45 |
34:45.90 |
00:13.90 |
9 |
48 |
Richard Small |
|
39 |
225 |
04:28.15 |
39:14.05 |
00:14.60 |
10 |
42 |
Ben Haby |
|
42 |
267 |
04:32.20 |
43:46.25 |
00:18.65 |
11 |
45 |
Luis Pena |
|
45 |
312 |
04:37.05 |
48:23.30 |
00:23.50 |
12 |
46 |
Justin Platt |
|
47 |
359 |
04:47.15 |
53:10.45 |
00:33.60 |
An event reaction -
"This was awesome!! Had a Foot Locker feel - teams, gear for the athletes (Puma), socializing among these Texas stars and the not-as-well-known. Dinner and race day interaction with the Governor."
Race Information
This is a new "event" in Texas - a high school Elite division in the Congress Avenue Mile road race. The interest has been high and almost all the best in Texas will be there. Weekly rankings were posted and used to invite the top 80 athletes (10 boys and 10 girls from each geographic region) after District meets and the additional 16 after Regionals two weeks later.
"The Elite High School event will be the featured race at this year's Congress Avenue Mile. Each year, after the state championships, many ask the question, who is THE state champion? What would happen if the best Texas high school milers were given the chance to come together for a showcase of the best the state has to offer? The Congress Avenue Mile will give Texas high school milers that chance in a unique setting in beautiful Austin with the Capital in the background. 48 girls and 48 boys will go head to head on May 20th to answer those questions."
Teams by Region:
The state will be divided into teams according to four regions: North, South, East, and West. An athlete’s region will correspond with his/her UIL regional representation:
North = Region II
South = Region IV
East = Region III
West = Region I
Each region will send its best 12 girls and boys as representatives in the championship. The team scoring process and eventual champion will be similar to that of a cross country meet. The first five runners for the region will combine for the team score. However, rather than cumulative places, the races will be scored according to the cumulative chip time of the 5 runners.
Qualifying Process:
The fastest 12 times outdoor times (all classes combined) from each region performed in a high school race will qualify. The rankings will be compiled and updated each week as the season progresses. The qualifying period ends with the UIL Regional Championships. Any performances recorded beyond the Regional Meet will not be considered. The weekly rankings can be found on the Cross Country Coaches of Texas’ website at www.cccat.org.
Keynote Speaker and Luncheon:
We are proud to have American 5000 meter record holder and one of the greatest distance runners of all-time, Bob Kennedy, as the keynote speaker for the pre-race luncheon. The athletes will enjoy a meal as well as have the privilege to hear Mr. Kennedy share his running experiences as a high school star in Ohio.
Awards Dinner:
The day of competition will be followed with an awards dinner. The team and individual champions will be recognized at this time.
Team Apparel:
No competitor will walk away from this event empty handed. Each elite athlete will be provided a uniform, as well as other running apparel.
Coaches:
Each region will be represented by four honorary team coaches (two girls and two boys coaches). The coaches will oversee their team on race day and accompany them to the luncheon and dinner. The team coaches will be named at a later date.
We look forward to this unique event. We believe it will be a truly memorable competition for all athletes privileged enough to qualify. If you have any questions about the race please contact Coach Timo Sheard at [email protected]
Schedule:
9:40 am Girls Elite
9:50 am Boys Elite
Qualifiers
Boys http://cccat.org/texas_boys_1600.htm
Girls http://cccat.org/texas_girls_1600.htm