IL-Peoria
Peoria IL
Report of
Measurement
of the
IHSA State Final
Cross Country Course
Detweiller Park
Peoria, Illinois
19 and 20 July 2008 Summary of Findings
Course Diagrams
History of the Detweiller Park Loops
Course Measurement Methods
USATF vs. NFHS Line
Frequently Anticipated Questions
Appendix: Measurement Data
The Measurement Team
Summary of findings IHSA State Final Cross-Country Course Detweiller Park- Peoria, Illinois The IHSA State Final Cross-Country Meet course was measured on July 19 and 20, 2008. The course was measured along its current and historical configurations using a number of different methods, and following two different guidelines regarding the line to be measured. The alignments measured were: · 1972-2002 historical configuration · 2003-2004 historical configuration · 2005-2007 current configuration The methods used were: · Steel measuring tape · Calibrated bicycle · Measuring wheel · GPS The lines measured were: · USATF (and NCAA) line (shortest possible route) · NFHS line (center of course) The routes were determined by personal recollection, interviews with individuals involved with the events, review of videotape, and study of aerial photographs. | Course | Instrument | Rule Book | Meters | Miles | Difference | | 2005-07 | Steel Tape - OCRS® Method | USATF SPR | 4788.88 | 2.9758 | Gold standard | | 2005-07 | Calibrated Bicycle | USATF SPR | 4782.45 | 2.9717 | -0.0041 | | 2005-07 | GPS - Bike Garmin Edge 305 ~9 mph | USATF SPR | 4797.32 | 2.9727 | -0.0031 | | 2005-07 | GPS – Walk Garmin Edge 305 ~3 mph | USATF SPR | 4784.11 | 2.9809 | 0.0051 | | 2005-07 | Wheel Un-calibrated - "Inexpensive" | USATF SPR | 4758.54 | 2.9568 | -0.0190 | | 2005-07 | Wheel Un-calibrated - "Expensive" | USATF SPR | 4747.93 | 2.9502 | -0.0256 | | 2005-07 | Steel Tape - OCRS® Method | NFHS 20' path | 4864.24 | 3.0225 | 0.0467 | | 2005-07 | Calibrated Bicycle | NFHS 20' path | 4858.21 | 3.0188 | 0.0430 | | 2005-07 | GPS - Bike Garmin Edge 305 ~9 mph | NFHS 12' path | 4820.00 | 2.9950 | 0.0192 | | 2003-04 | Added second bridge to gold standard | USATF SPR | 4809.21 | 2.9883 | 0.0125 | | 2002 | Calibrated Bicycle | USATF SPR | 4789.27 | 2.9759 | 0.0001 | | 2002 | GPS - Bike Garmin Edge 305 ~9 mph | USATF SPR | 4782.51 | 2.9717 | -0.0041 | | 2002 | Calibrated Bicycle | NFHS 20' path | 4861.30 | 3.0207 | 0.0449 | Table 1: Measurement Results Conclusions: · The 2007 and 2002 courses are approximately the same length. The error inherent in the measurement methods and the reconstruction of the historical courses is probably greater than the measured difference between the courses. Given the relatively small difference between the results and the inherent difficulty in reconstructing a course that was run as many as 35 years ago it is impossible to say that one course was longer or shorter than the other. · The current and historical courses, when measured over the shortest possible route (or USATF line), are shorter than 3.000 miles by about 0.024 miles, or about 7 seconds for someone running near record pace. · On the other hand, the fact that the courses measured longer than three miles on the NFHS line does not mean that the courses are longer than three miles. It most likely means that we assumed a wider path width than the IHSA used to define the course. There is a legitimate route around both the new and the historical courses that, when measured in accordance with NFHS rules, is exactly three miles. Under the rules of the NFHS the IHSA is correct in representing the course as 3.0 miles. A course width of about 12 feet would explain the differences between the NFHS and USATF lines. · Of the various measurement methods, the steel tape is the most accurate, within 5 feet over three miles. The calibrated bicycle is reasonably accurate, especially when calibrated over a surface similar to the running surface. The measuring wheel generally produces a result short of the actual length of the course. Although an un-calibrated wheel is not accurate enough for record keeping, the numerous coaches who have measured the course over the shortest possible route using a measuring wheel and have concluded that it is short of 3.000 miles have been correct. GPS results vary based on the speed of the unit during measurement and is generally not accurate enough to measure a competitive race course.
IHSA Cross Country State Final Course Detweiller Park - Peoria, Illinois Scale Course Diagrams The following course maps were created using an aerial photograph (shown in Figure 4) taken during the winter after the 2001 State Meet as a scale backdrop for the graphic overlays. An effort was made to place every tree as it stood on August 3rd 2008. The mile markers and other points of interest have been placed in their correct relative positions to make it as easy as possible to find all the markers. Comments on Figure 1: 1971-2002 Course Map: The measurement of the 2002 course is relatively accurate because the aerial photograph shows the paths run on the course that year. The location of the finish was somewhat in doubt but all the known data correlated to one area, so confidence is high that the measurement is within 25 feet. However to say that this map describes the course as run in 1972, the year Craig Virgin ran 13:50.6, is problematic. First, the tree near the 1.5-mile mark does not appear to be 35 years old. Additionally, the path is frequently defined by evergreen trees and the girth of those trees defines which line can be run. It’s fair to say they are a lot wider than they were in 1972. Many trees in the 2002 photo are gone today and some have been planted since, so there might have been other landscaping changes since 1972 that do not show up in this diagram. In the final analysis we are left with the hard data of 2.976 miles measured over the 2002 course, as compared to anecdotal data from the 1970’s when the course was widely believed to measure 2.97 miles. Comments on Figure 2: 2003-2004 Course Map: The course was changed to allow automatic timing, but the old bridge was the only pass through between the North and South sections. An explicit measurement of this course was not made but it is assumed to be longer than the 2005-2007 course by the additional length run when returning all the way back to the old bridge before turning back west south of the creek. If the course differed in any other way, then new measurements will have to be made to determine the actual length. Comments on Figure 3: 2005-2007 Course Map: The second (new) bridge is added. Tape measurements showed every marker to be short of the actual distance as defined by USATF standards. Note how the margin of error grows along with the length of the course. This is consistent with the theory that the IHSA has defined the course down the middle of the path according to NFHS rules as opposed to the inside of every turn and between the tangents as specified by USATF rules. If the error were due to a missed tree or some other misinterpretation of the course, we would expect to see the markers correctly placed up until the error, and then we would expect to see the remaining markers off by the amount of the error until the finish. The 1.5 mile marker appears to be out of place regardless of the method of measurement. There were some discretionary points on the course, especially on the North loop where it was not clear if the path should have gone under or around low hanging braches. For this reason we have added 10 feet to the uncertainty of the course.
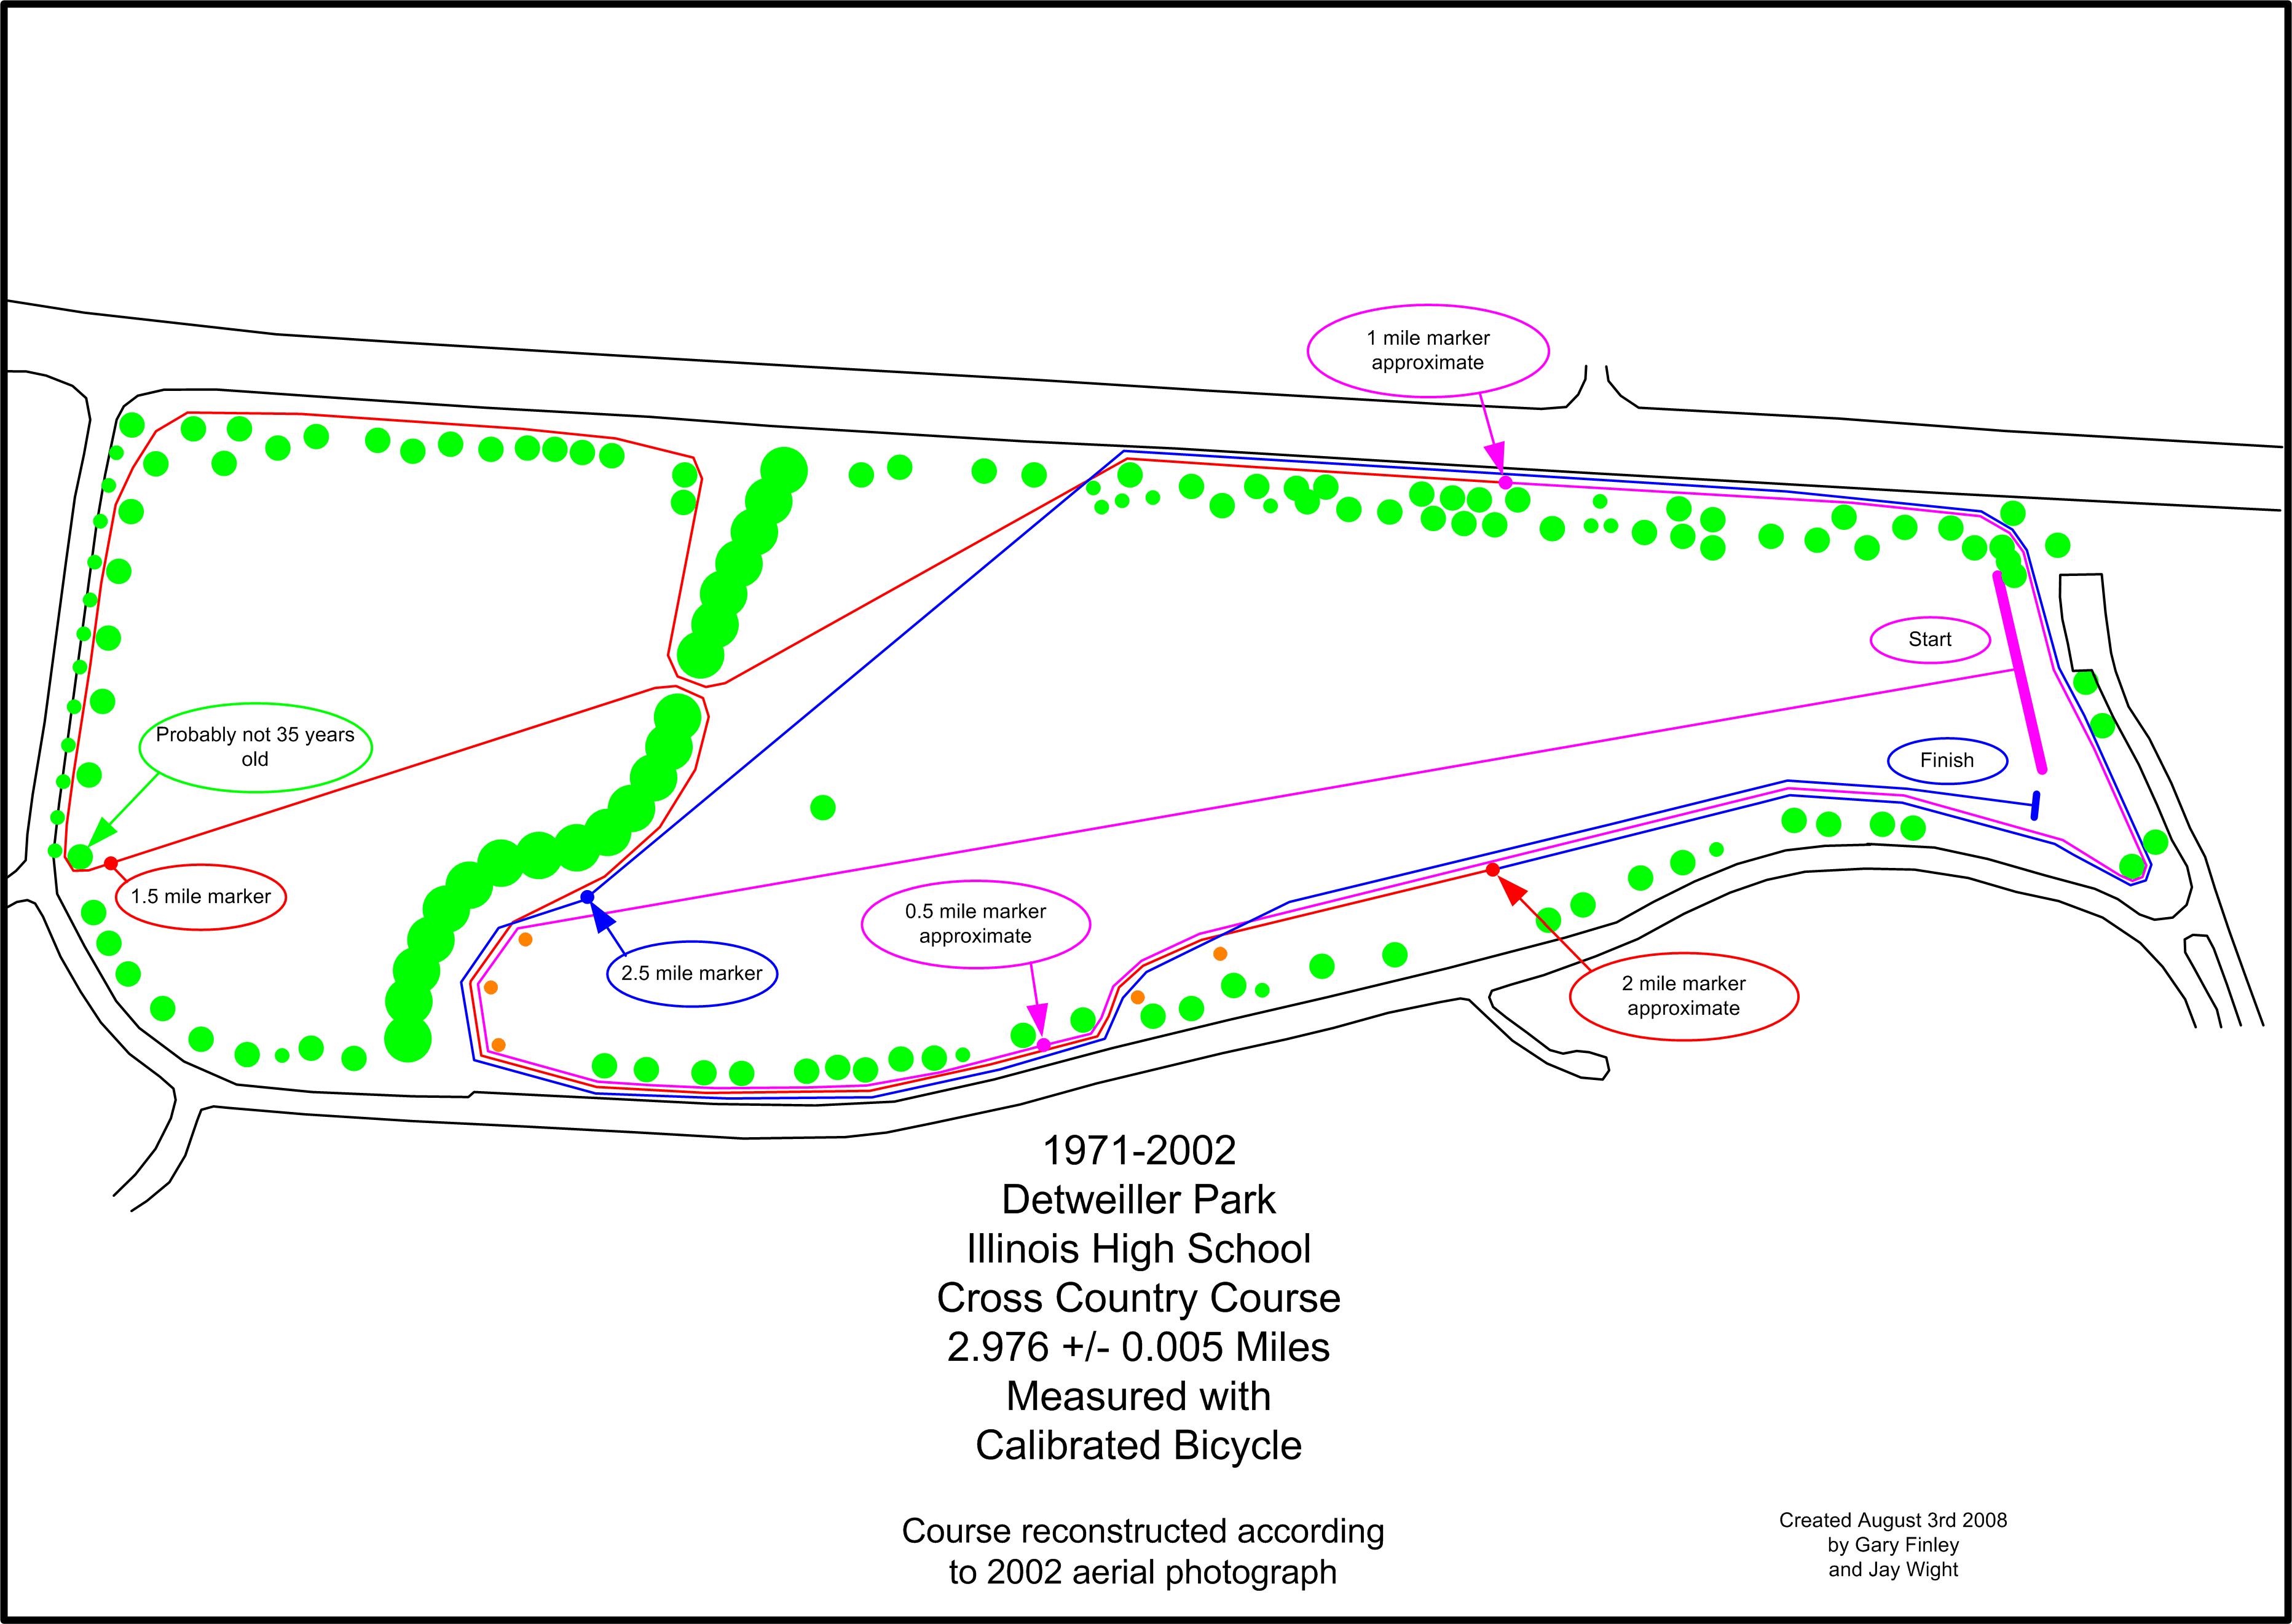
Figure 1: 1971-2002 Course Map
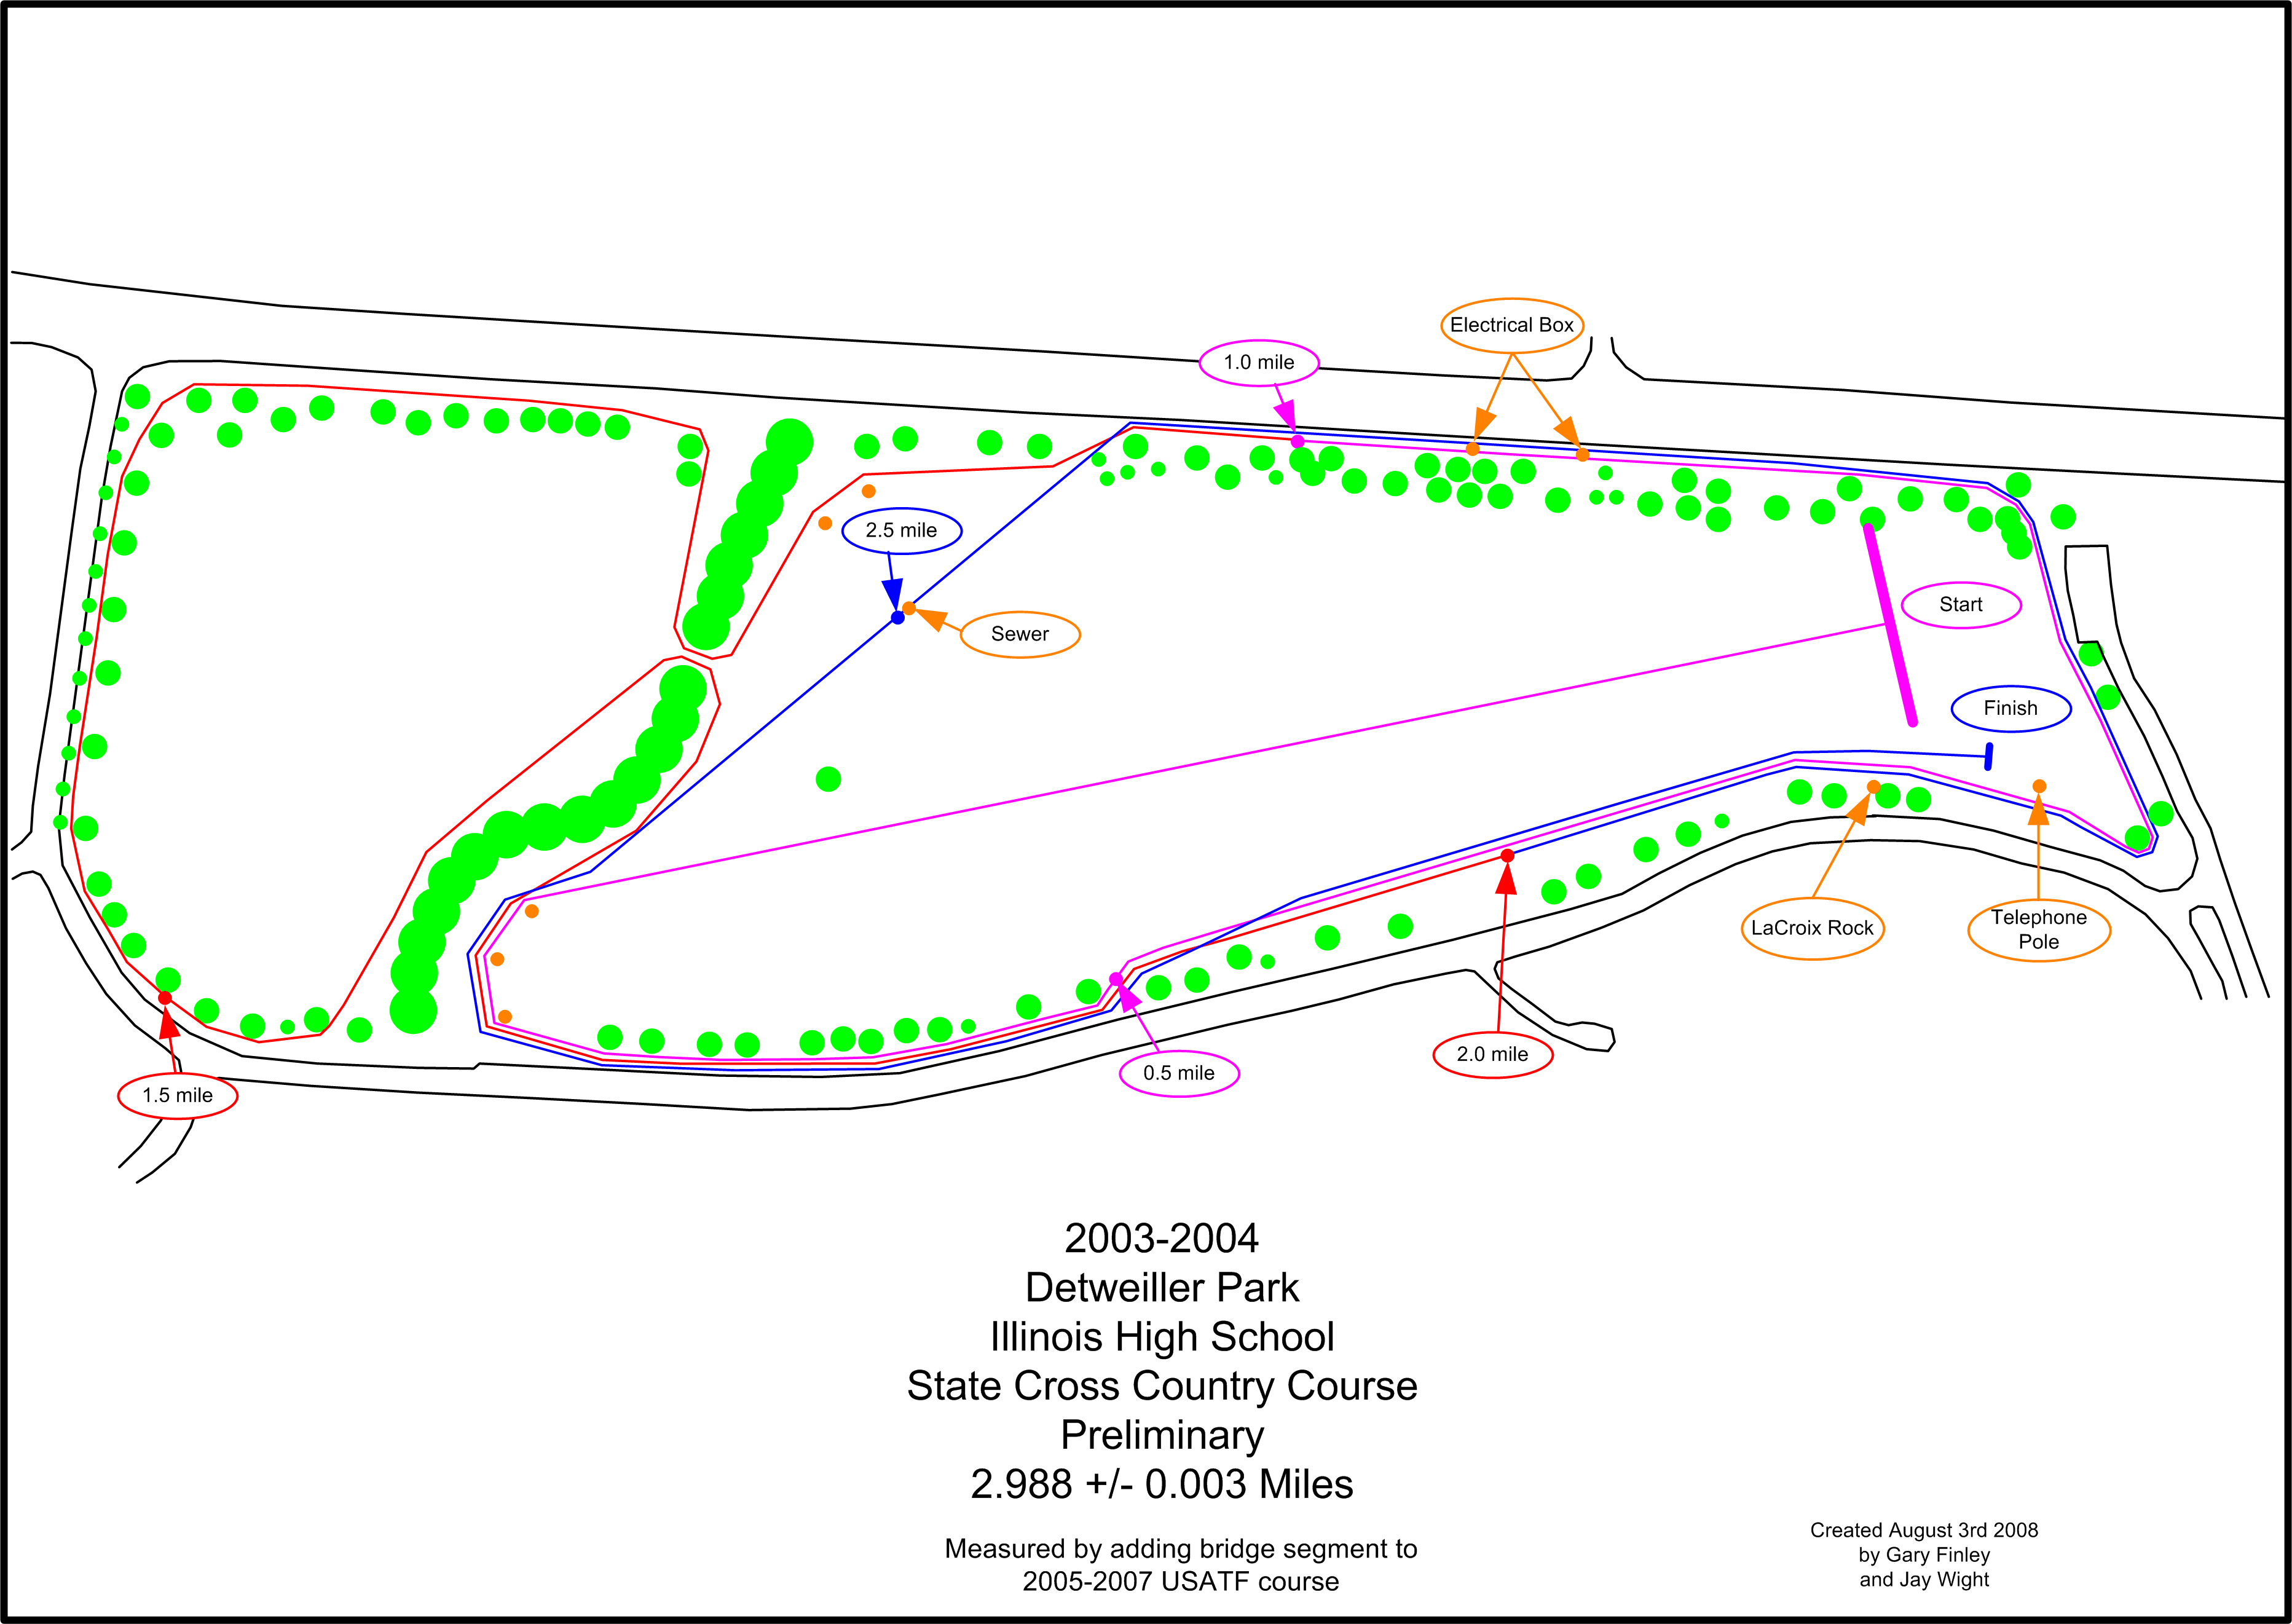
Figure 2: 2003-2004 Course Map 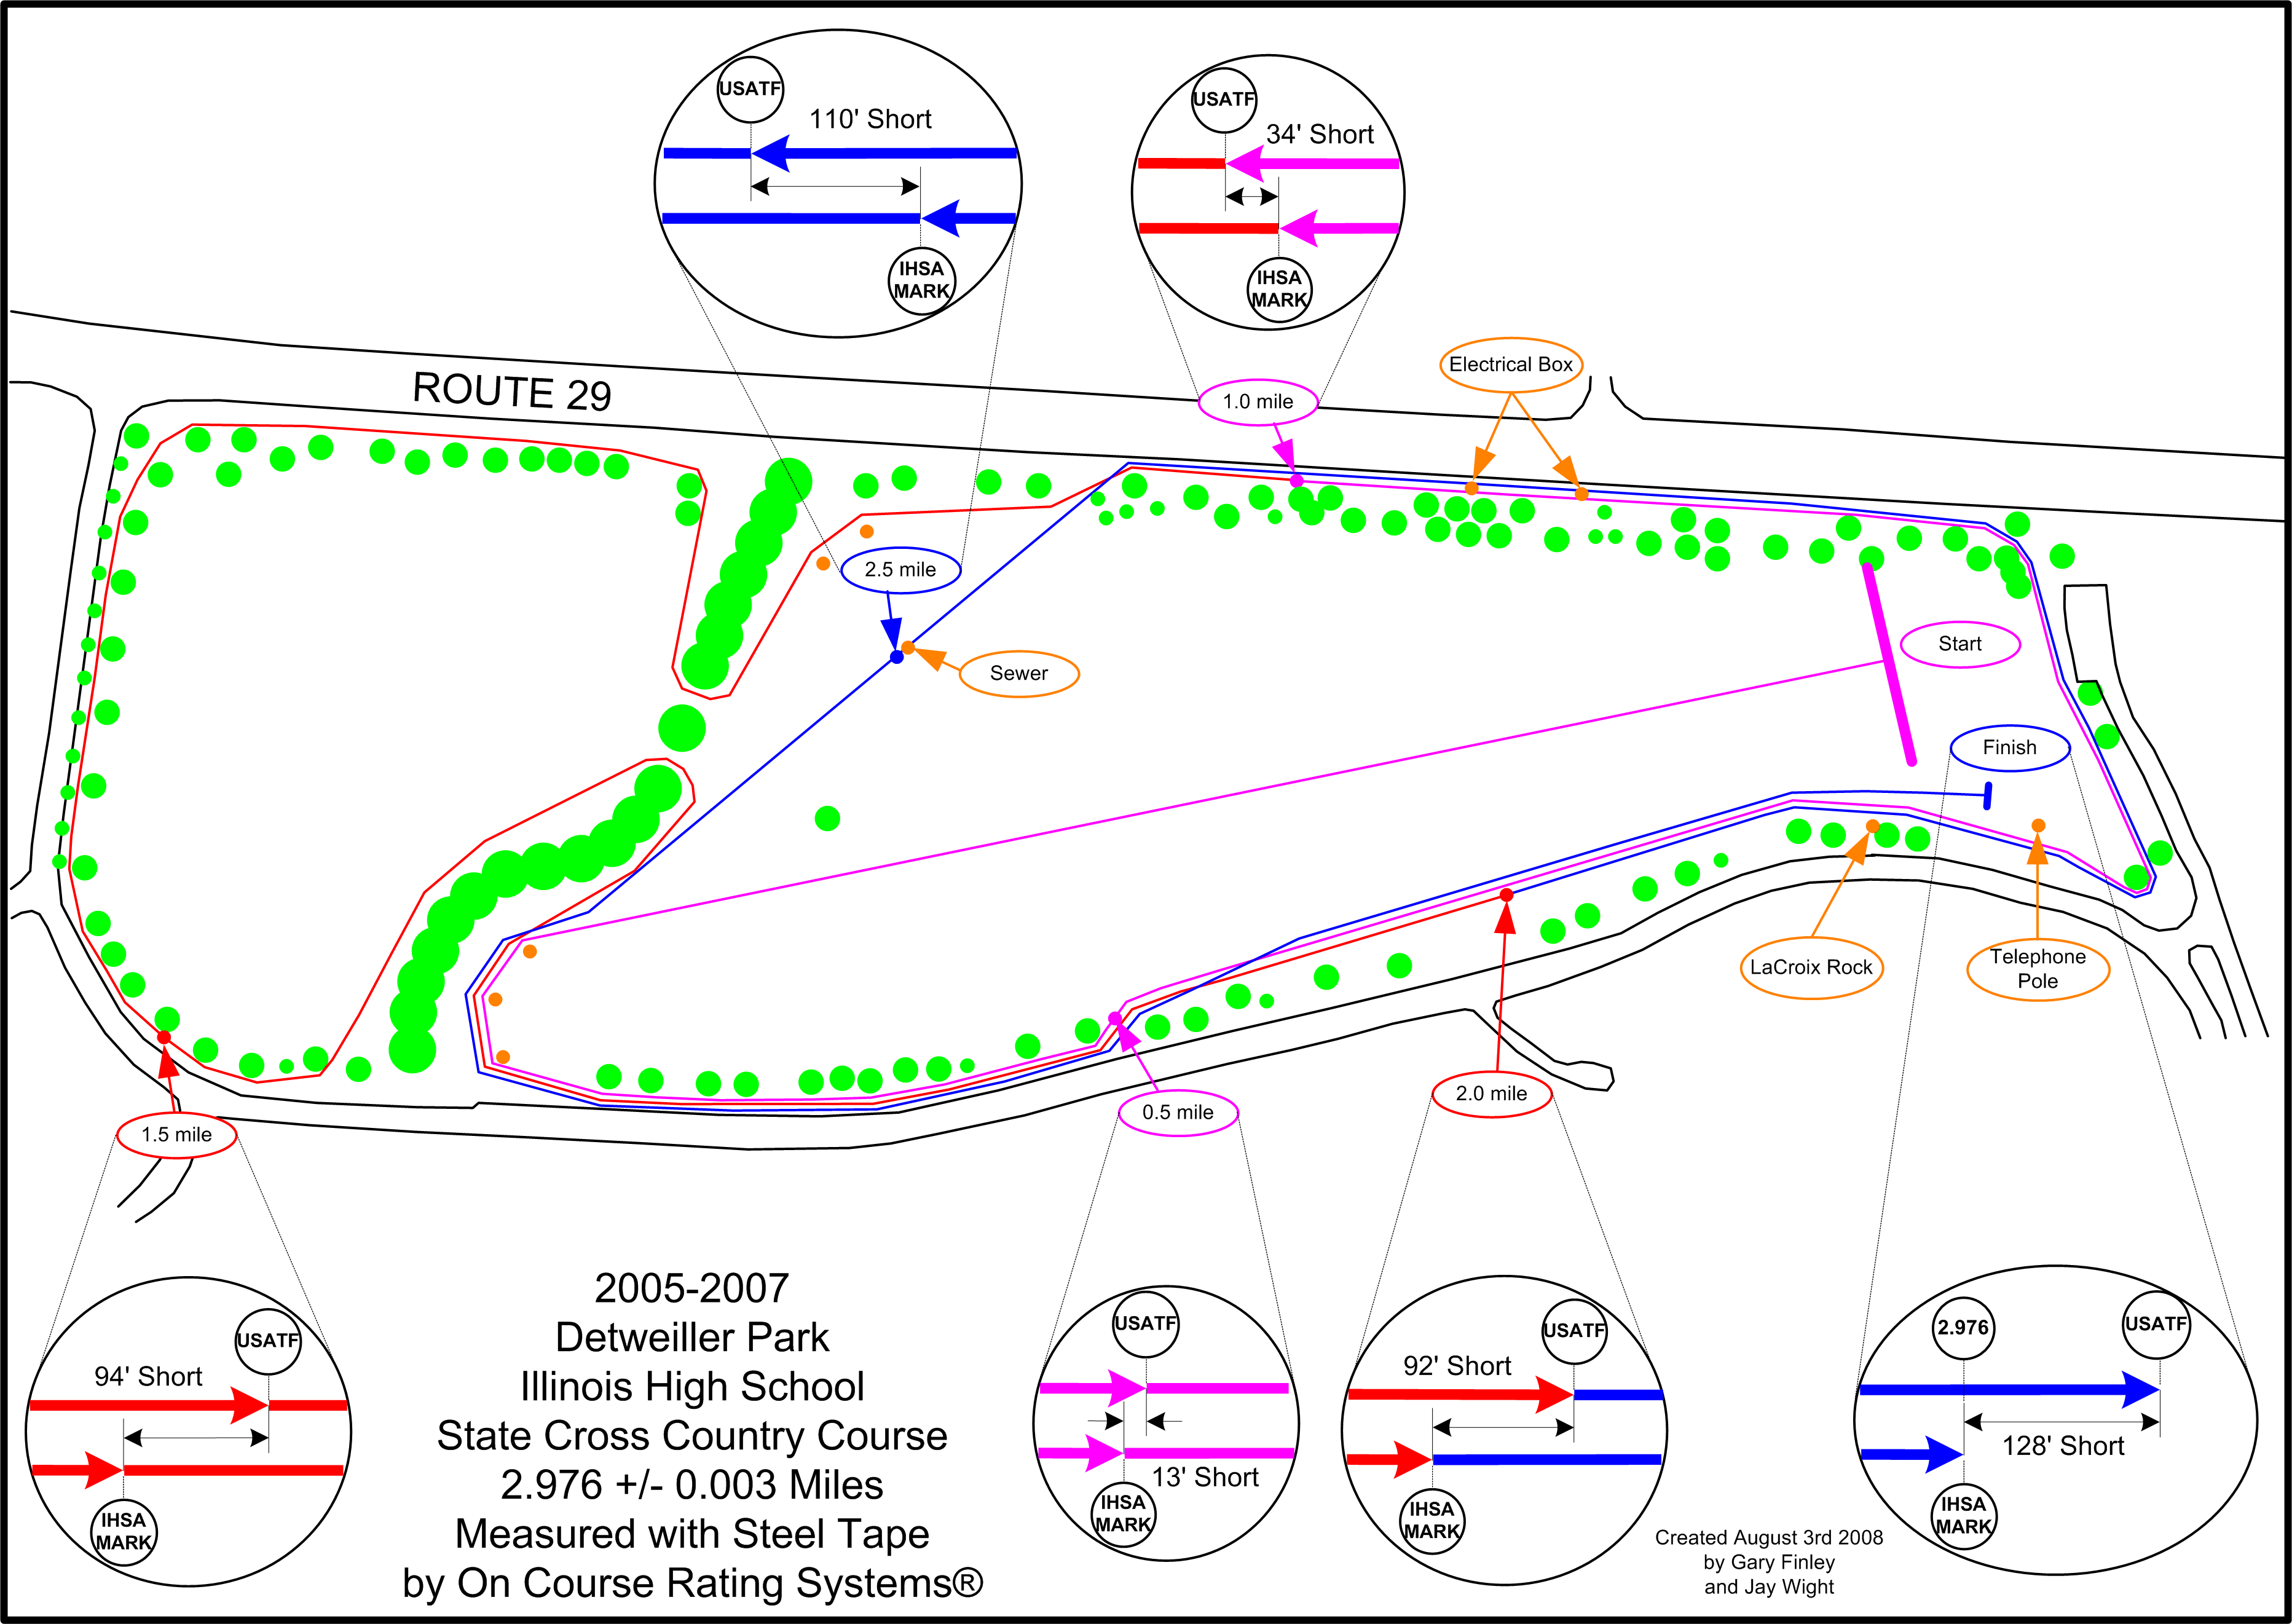
Figure 3: 2005-2007 Course Map 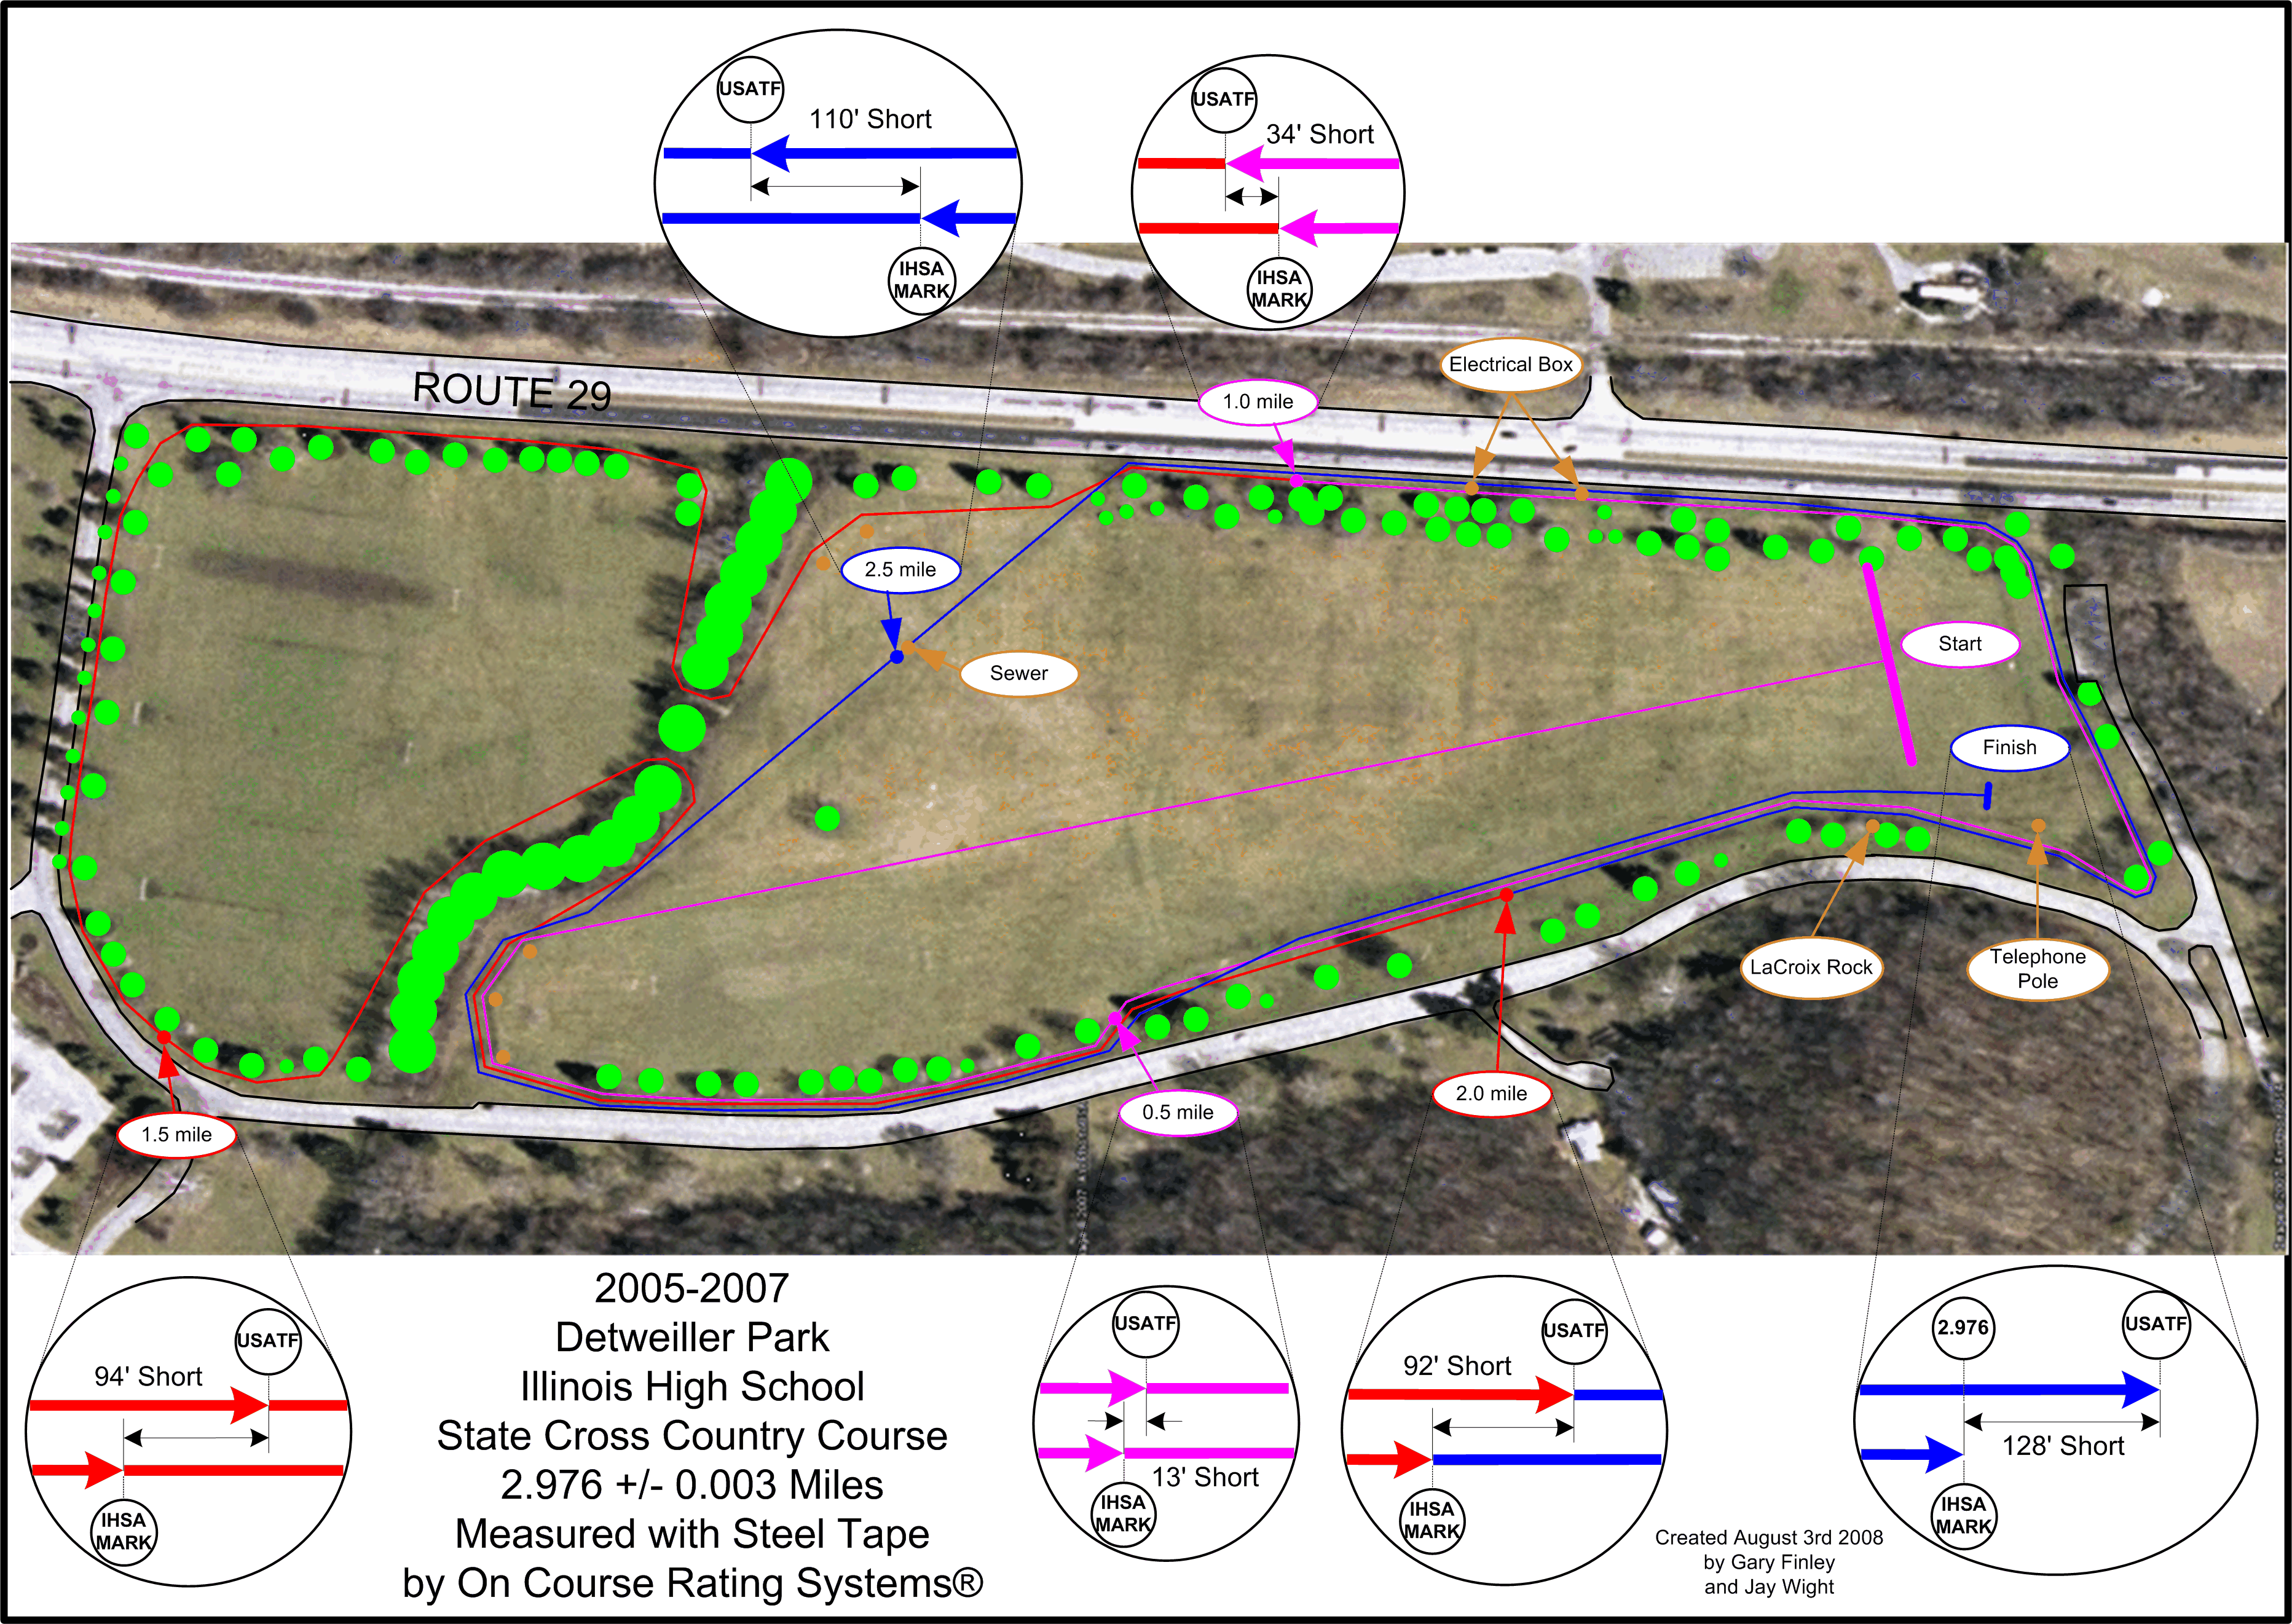
Figure 4: 2005-2007 Course Map with Aerial View
History of the Detweiller Park Loops The IHSA State Final Cross-Country meet has been held at Detweiller Park since 1970. In 1971, the distance of the race was advertised as 3 miles for the first time. The 1971 course was essentially unchanged until 2003, when the finish area was relocated and reconfigured in order to accommodate computer chip scoring. The start was also moved north to provide room for activities related to meet administration, timing, and scoring, and changes were made elsewhere on the course to make up the lost distance. The course was originally configured as follows: 
Figure 5: Original Map of Boys Course
In 1979, a girls’ state final meet was held for the first time. It started and finished at the same location as the boys’ race, and generally used the same terrain, but omitted one loop used on the boys’ course. The distance of this course, according to the IHSA, was 2.1 miles. 
Figure 6: Original Map of Girls 2.1 Mile Course
In 1998, the length of the girls’ State Final race was changed, according to the IHSA, to 2.5 miles. The long loop that includes the “triangle” north of the creek was replaced with two laps of the loop around the south meadow. Here is the configuration of that course. 
Figure 7: Original Map of Girls 2.5 Mile Course In 2002, the length of the girls’ State Final race was increased to 3 miles, and the girls raced over the same course as the boys. The boys and girls have raced over the same course each year since 2002.
The 1971-2002 Detweiller Park courses were essentially comprised of three loops. All of the loops share the section of the course between the middle of the first turn and approximately the two mile mark along the west side of the course, so they can be assembled and disassembled in a number of ways. The loops are as follows: The start to finish loop (Loop F). This segment is not really a loop, as it doesn’t close on itself, but just to be consistent we’ll call it one. Predictably, it goes from the starting line around the first turn and back to the finish line. Along the west side of the course it follows the same line as the other two loops until it veers toward the finish chute just before the finish. The configuration of this segment in the current course is essentially unchanged from the 1971-2002 course, with the important exceptions of the start and finish, both of which have been moved north. The cone or flag that directed the runners into the open field at the evergreen tree just south of the half mile mark is also no longer used. The configuration of the first turn at the north end of the segment is essentially the same as it was from 1971 to 2002. 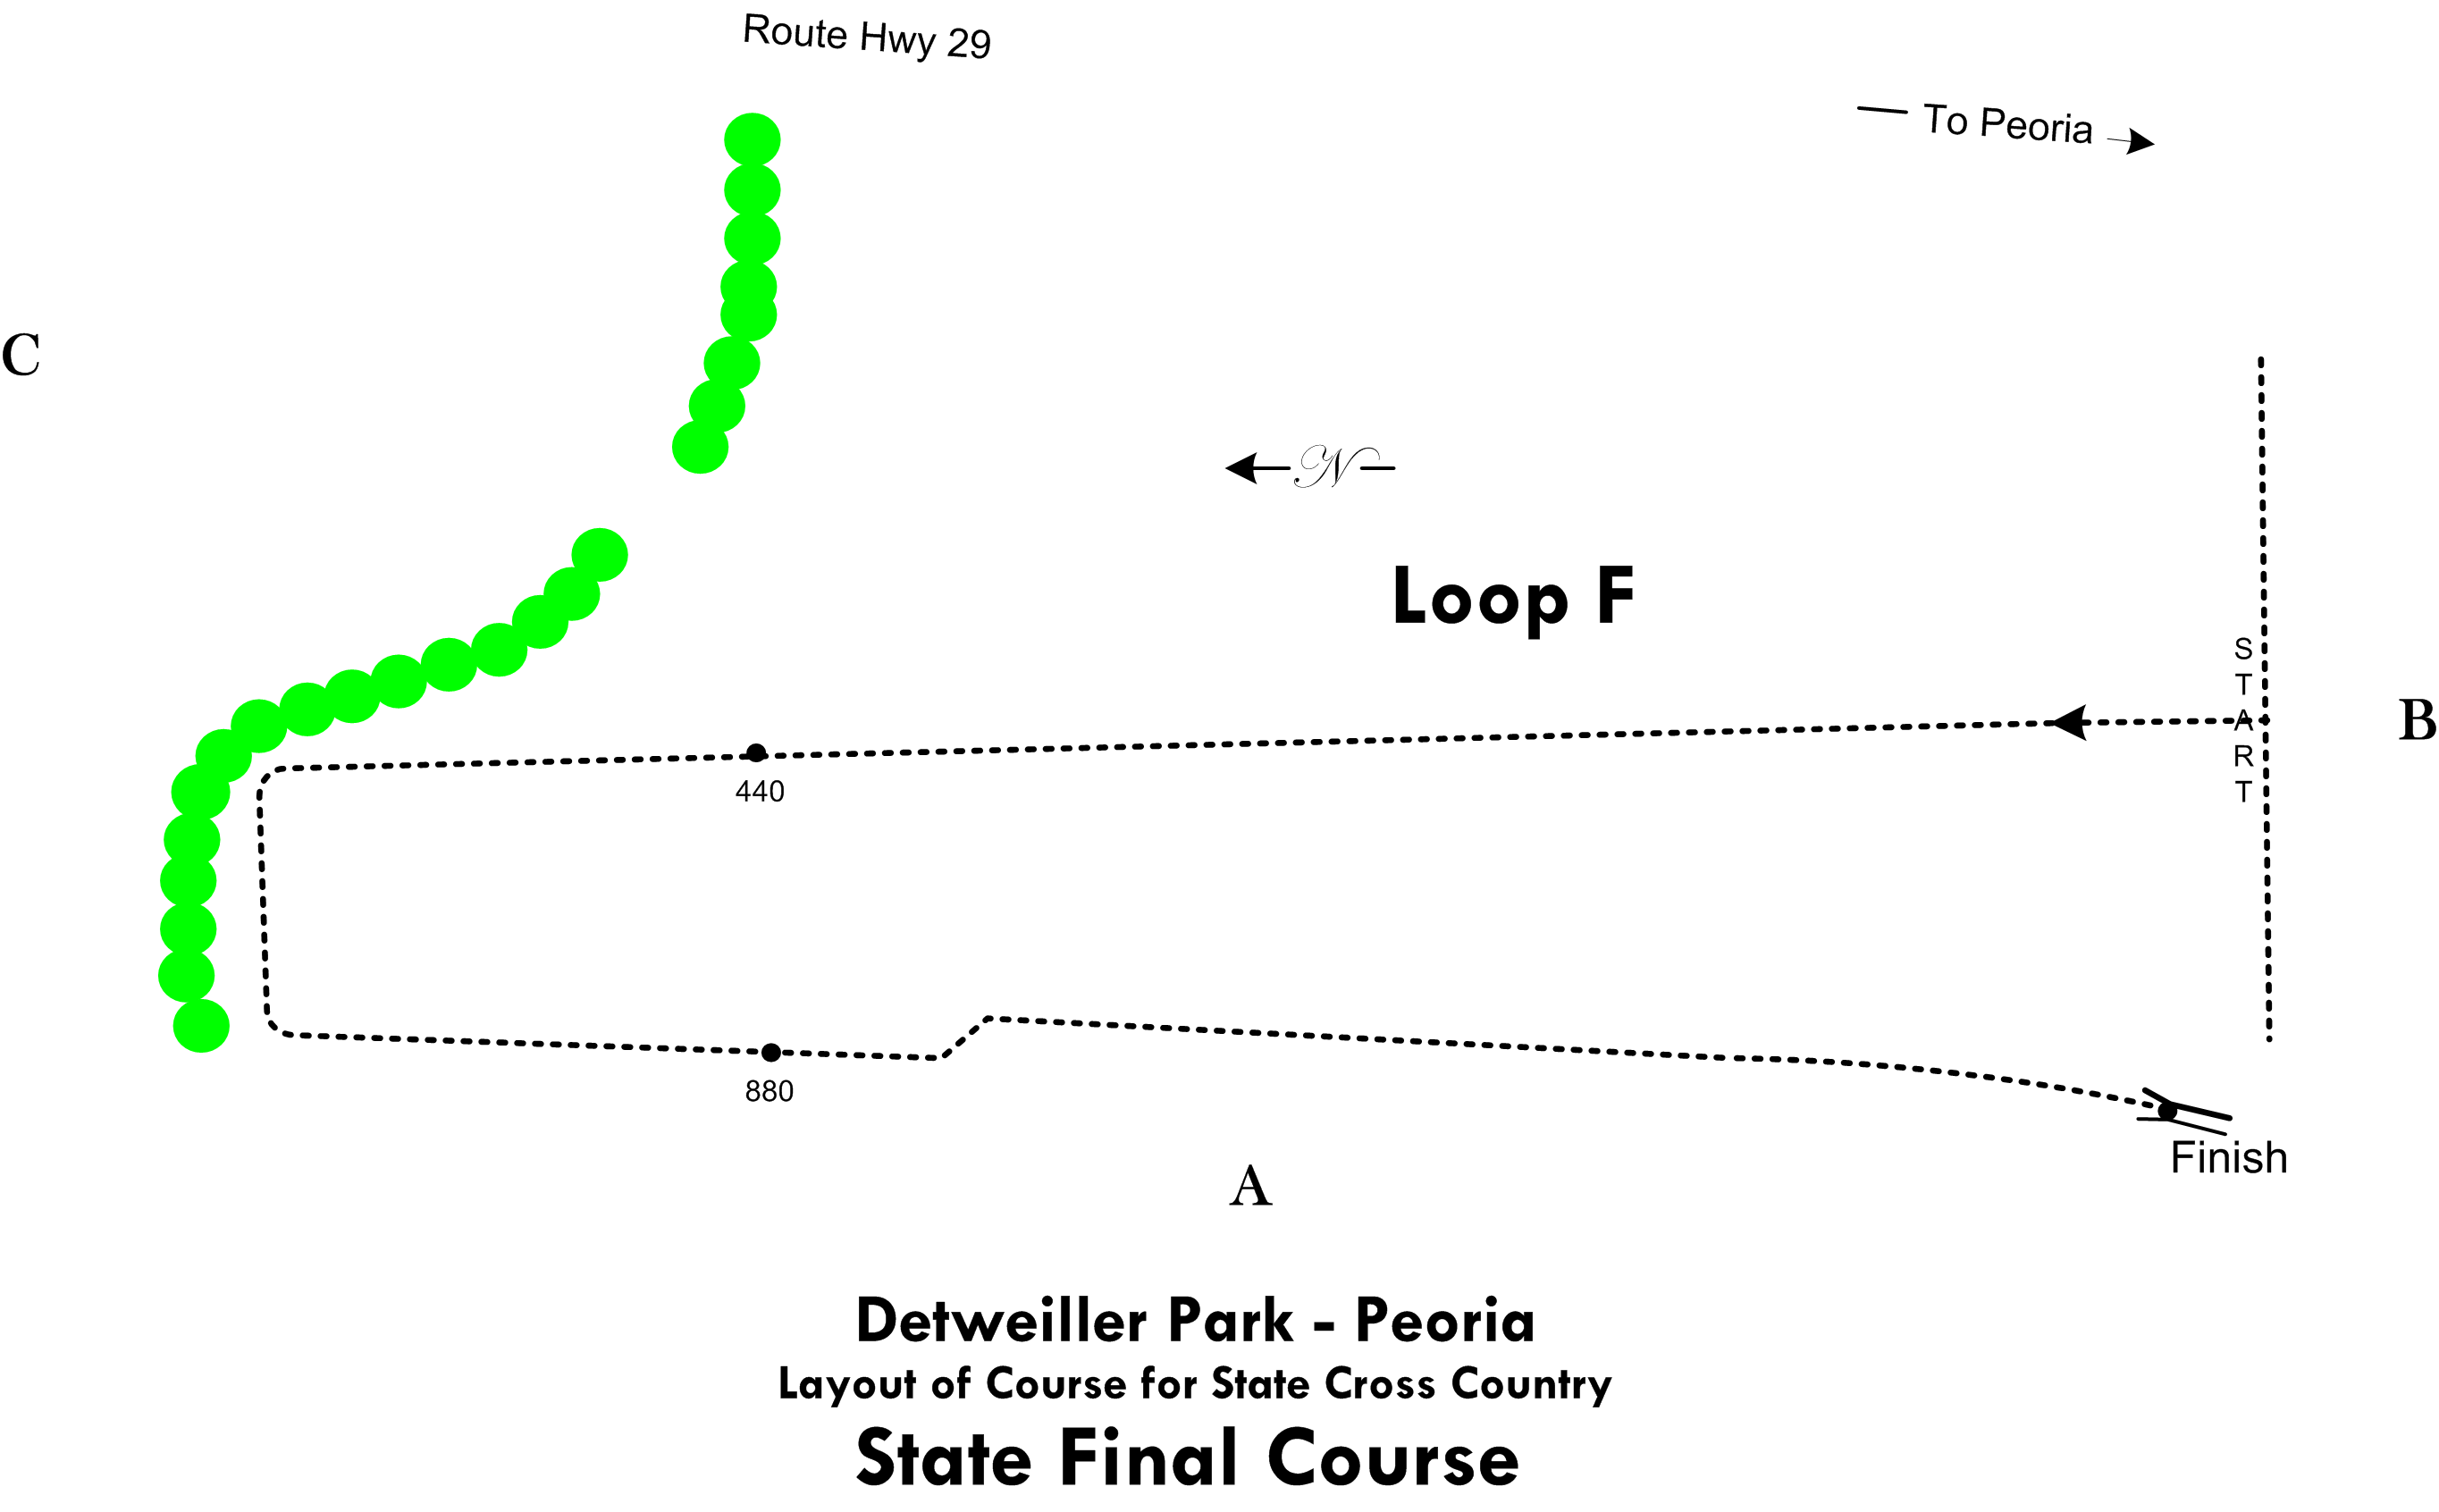
Figure 8: Loop F
The short loop (Loop S). This loop essentially follows the perimeters of the south meadow, except at the northeast corner, where it cuts across the meadow to rejoin the perimeter at the first turn. The turns are largely defined by large trees except for the first turn at the northwest corner of the loop where permanent steel posts have replaced the trees that were once there. It should be noted that this loop is still used, in pretty much its original form, in the current State Final course. The only material difference is that the cone that was once placed even with the large evergreen tree just south of the current half-mile mark was removed in 2003, and the runners are no longer channeled as far out into the “infield” as they once were. 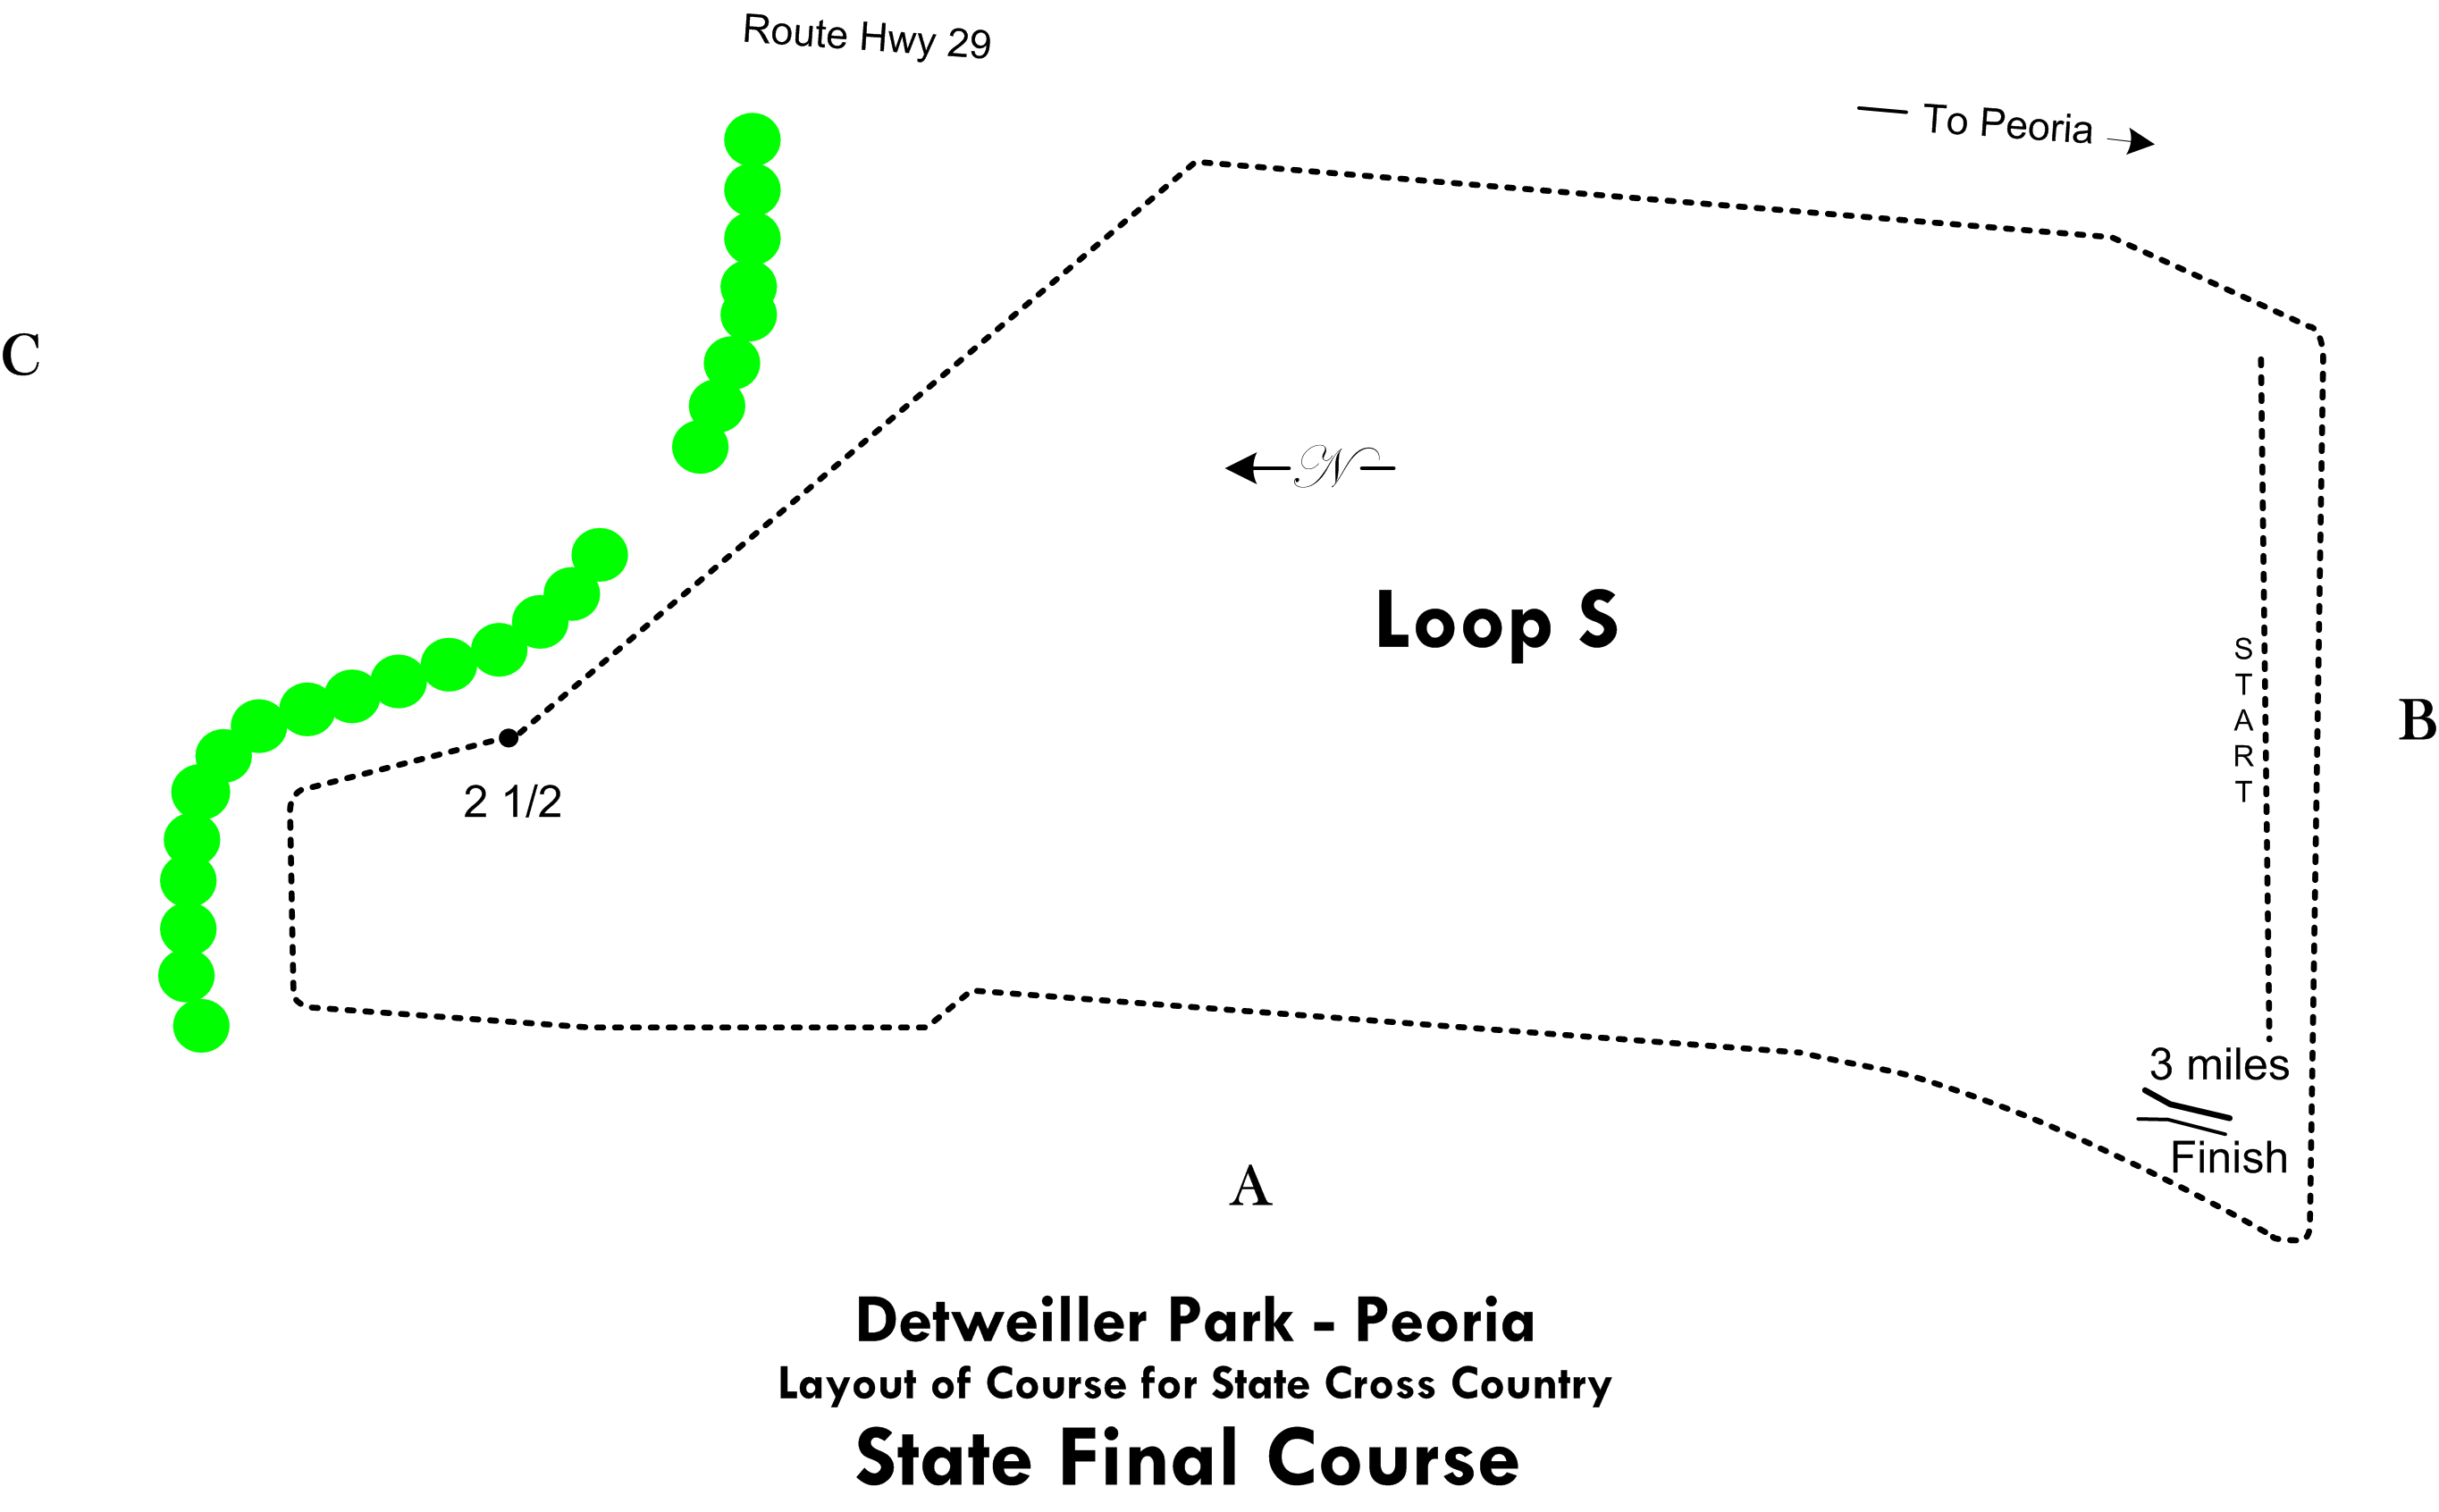
Figure 9: Loop S
The long loop (Loop L). This loop also follows the perimeter of the south meadow. At the northeast corner, however, instead of heading for the first turn, it heads for a bridge over the creek that defines the north end of the south meadow. It then runs another loop, commonly called the “triangle”, in the meadow north of the creek, returning to the bridge, and heading for and rejoining the short loop at the first turn. It is this loop that appears to have been changed the most from the 1971-2002 course to the current course. The north loop, or “triangle” has been reconfigured so that it is now defined by a line of trees along the road along the west perimeter of the meadow, almost to the creek, where it turns left and heads back for the pass-through. Additionally, at the entrance to the north loop, the course now follows the northeast perimeter of the south meadow while from 1971 through 2002 the runners were allowed to head straight for the pass-through when they turned left into the meadow. Finally, in 2005, a second pass-through was added west of the original one. Runners now enter the north loop through the east pass-through, and exit it through the west pass-through. 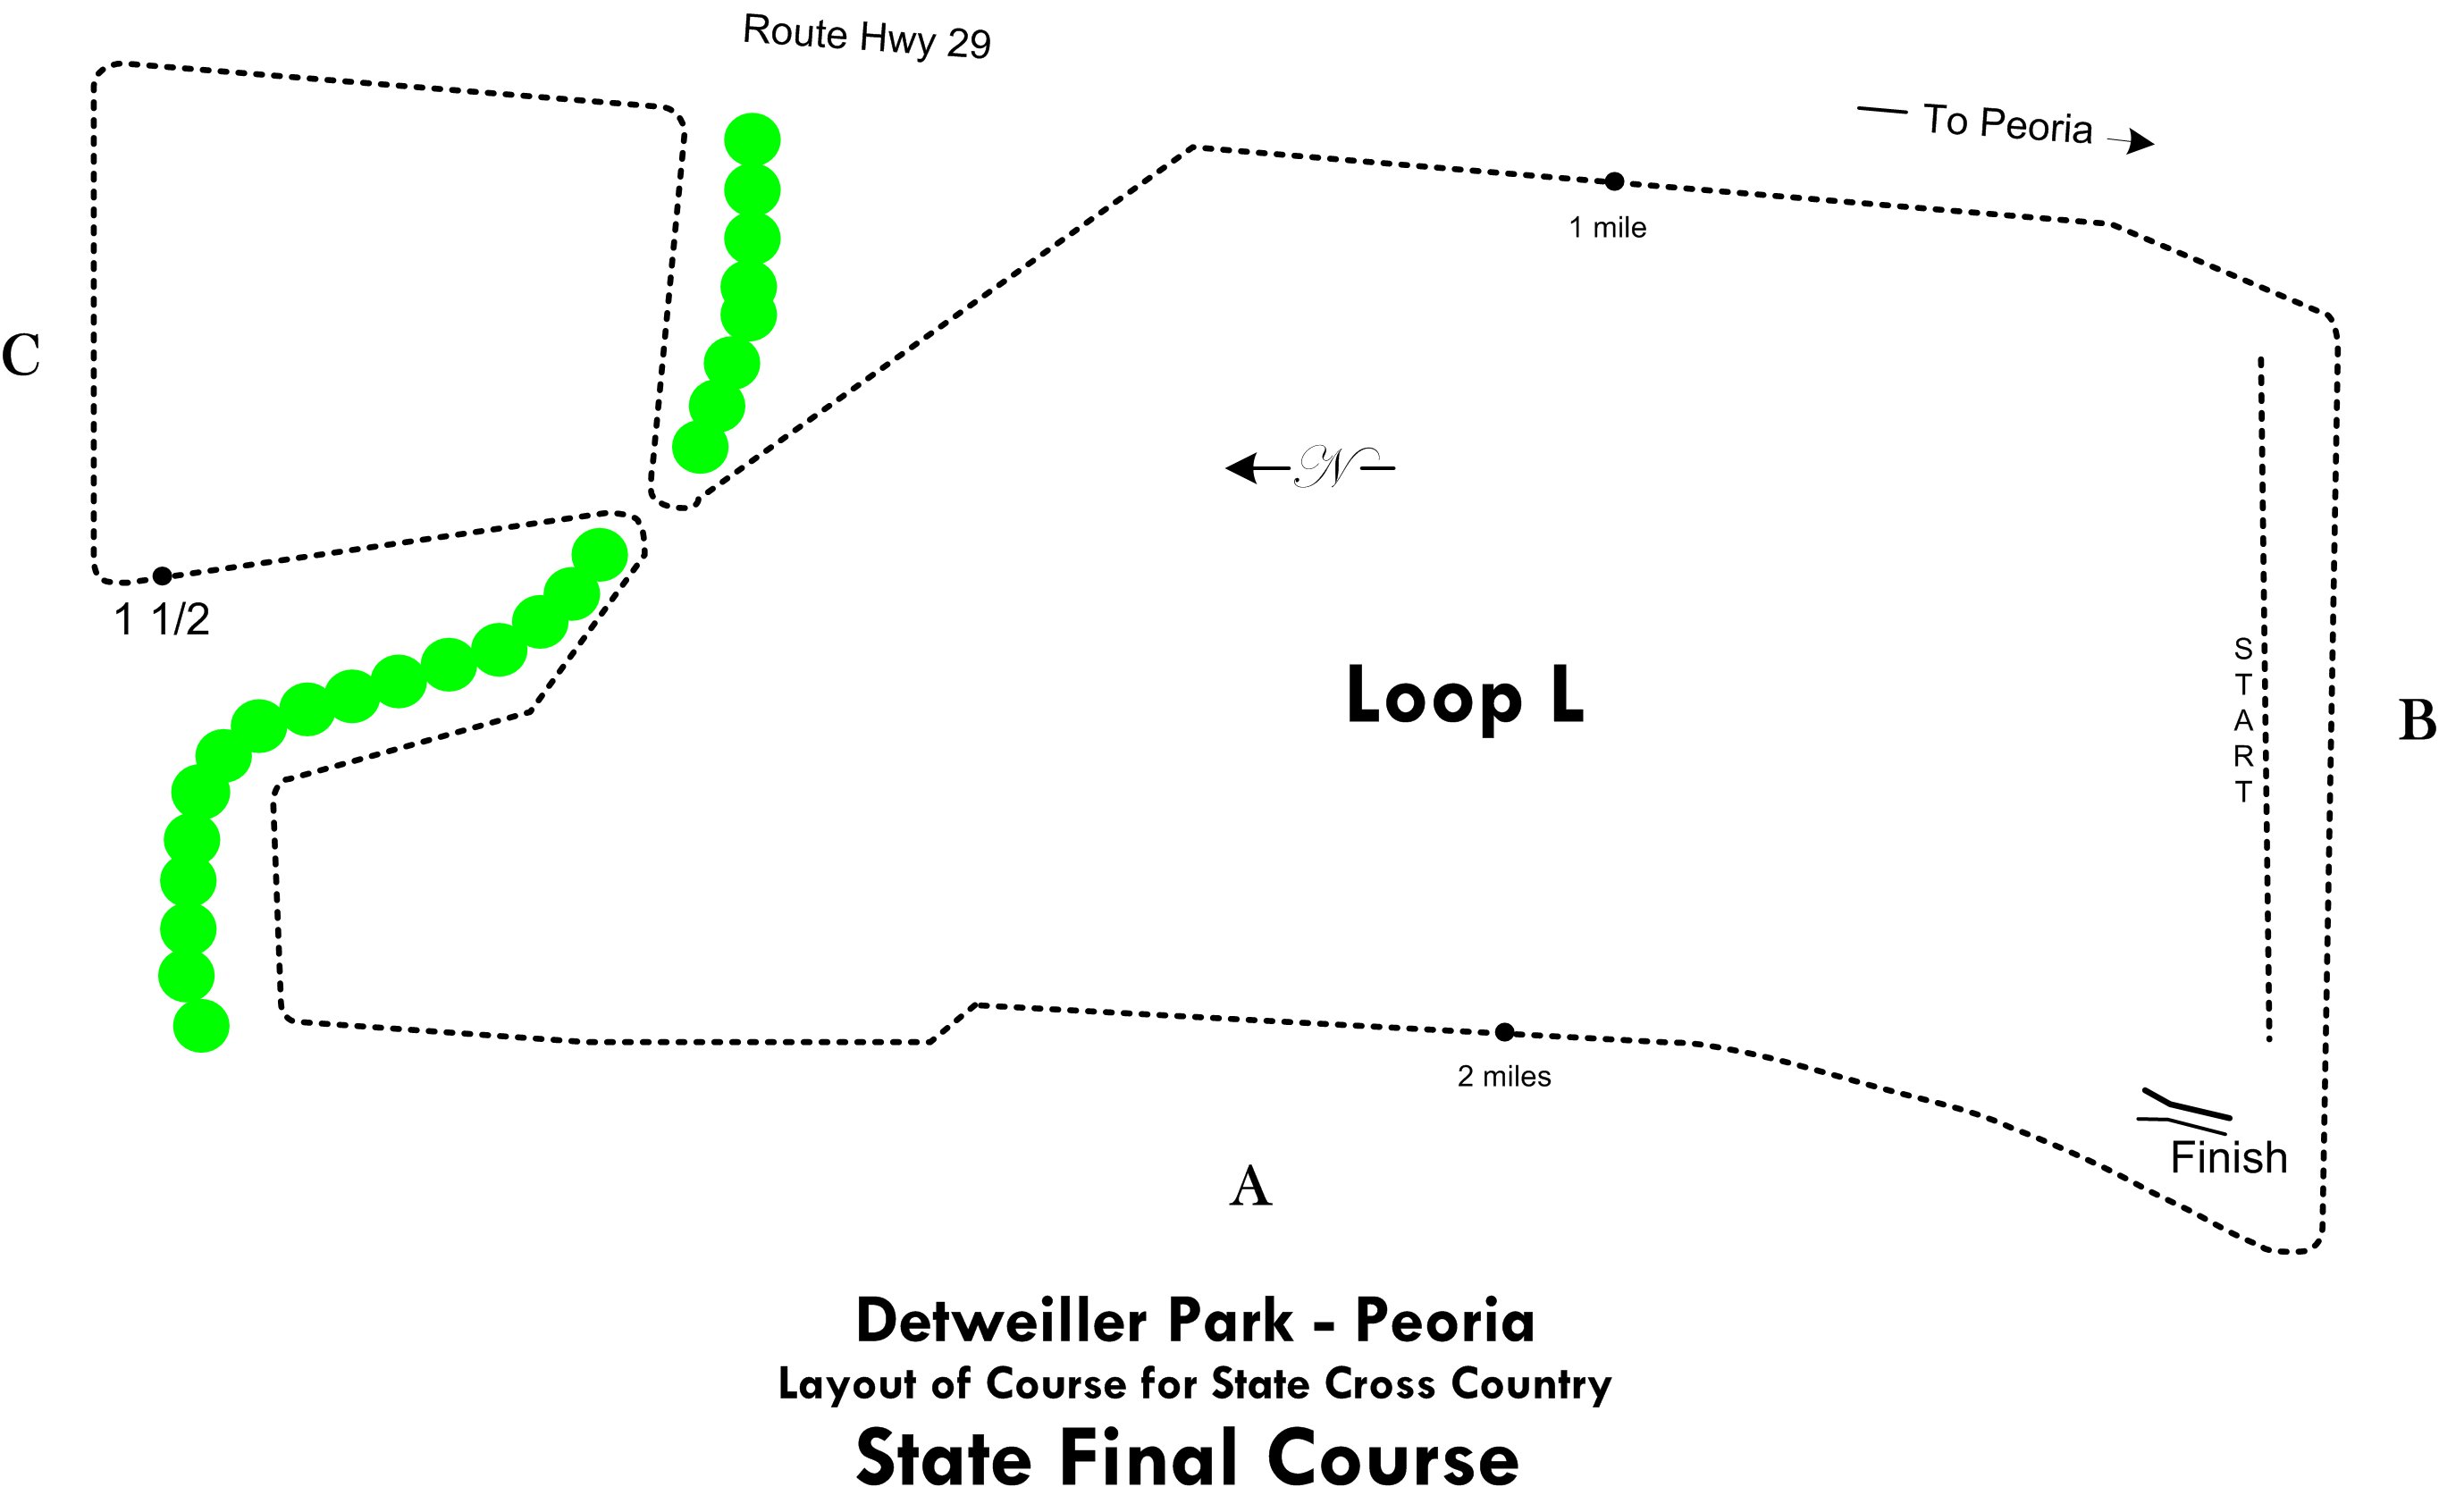
Figure 10: Loop L
How long would each of these loops have to have been? There were three courses, each with a different configuration of the three loops. · The boys’ course is F + S + L = 3.0 miles · The 1979-1997 girls course was F + L = 2.1 miles · The 1998-2001 girls’ course was F + S + S = 2.5 miles That sets up a system with three equations and three unknowns, which results in the following solution: · Loop F (start to finish) would have to have been 0.7 miles. · Loop S (short loop) would have to have been 0.9 miles. · Loop L (long loop with “triangle”) would have to have been 1.4 miles. How was the course changed in 2003? In 2003, the course (now one course since the boys and girls courses were now the same) was changed in a number of ways, with the stated purpose being to create more administrative area behind the start/finish area to facilitate the use of computer chip scoring. The changes were as follows: · The start and finish were moved north. · The flag or cone about 10 meters east of the large evergreen tree just south of the current half mile mark which sent runners into the “infield” was removed, and the runners now needed only to go to the left of the evergreen tree. It should be noted that the runners pass by this point on each of the three loops. It is not certain exactly when this was changed. It was definitely part of the course in 2002 and was not a part of the course in 2007. · Just past the mile mark, the route between the last tree on the east side of the course and the pass through into the north loop was altered. Previously, the runners headed directly to the pass-through. Now they are forced to hug the northeast perimeter of the south meadow before they enter the north loop. · In the north loop, the runners used to turn hard left at a tree across from the entrance to the parking lot by the concession/restroom building across the drive, and headed directly from there, across the fields, back to the original pass-through back into the south meadow. The runners now follow the perimeter of the north meadow, outside the tree line next to the drive, until they reach a tree almost to the creek, and then turn left and head back to the pass-through. Here is the 2003 course map, downloaded from the IHSA website: 
Figure 11: 2003 Boys and Girls Course Map The course was changed again before the 2005 season. A second pass-through, west of the original one, was added between the north and south loop. The runners now crossed the creek to enter the north loop on the original, or east pass-through, and crossed back through the new, or west pass-through. Here is a map of that course, downloaded from the IHSA website: 
Figure 12: 2005 Boys Course Map We do not know if the course was adjusted elsewhere in 2005 to compensate for the distance lost when the second pass-through was added. This course was also used for the 2006 and 2007 State Final Meets.
What methods were used to determine the route of the 1971-2002 course? · The START was established by viewing an aerial photograph of Detweiller Park taken in early 2002. It clearly shows a line of wear in approximately the area the start used to be. The approximate position of the line on the ground was determined by scaling distances on the aerial photograph and comparing them to actual distances on the ground. · The FINISH was also determined by the aerial photograph, but also from repeated viewing of video of state meets from 1985 through 2002. The time the runners took from a landmark tree to the neck of the finish chute was consistent with a distance from that tree, and the videos occasionally show the utility pole that stands in the finish area. · The PATH THROUGH THE NORTH LOOP was also established by viewing the aerial photograph, and the path was confirmed by a number of coaches familiar with the course in that area. · The location of the CONE OR FLAG JUST PAST THE HALF MILE MARK was estimated to be approximately 10 meters east of the east edge of the tree based on viewing videotape of various races from 1985 through 2002. For the purpose of this measurement, the locations of the 1971-2002 start and finish were estimated as follows: · The center of the starting line for the old course was set at 57’ north of the north curb of the parking area south of the starting area. · The finish line was set at 27.6’ south of the utility pole in the vicinity of the new finish area.
Course Measurement Methods The Detweiller Park cross-country course was measured using a number of different methods. An explanation of each follows. Steel Tape. The course is measured by pulling a steel measuring tape around the course. The tape is pulled tight over its entire length on straight sections of the course and laid on the ground along the appropriate radius around curves. A pin or flag is inserted into the ground at the end of each tape segment to mark the end of the tape and provide a starting point for the next segment. In the case of the Detweiller Park course measurement, a 50-meter tape was used, and the flags were numbered to allow the measurers to keep track of the number of tape pulls. Measurement using a steel tape is accurate but can be time consuming. One of the advantages of this method on an uneven surface like a cross-country course is that it tends to smooth out small surface bumps while accurately conforming to more significant terrain features that are of more consequence to the participants in the event. Surface conditions do not affect the accuracy of the measurement since the method does not depend on any kind of contact or friction with the ground. Calibrated Bicycle. The front wheel of a bicycle is fitted with a counter that counts fractions of a revolution of the front wheel. The bicycle is first ridden at least four times over a straight course of known distance, called a calibration course, and the results of the calibration are used to calculate a constant, usually expressed in counts on the counter per unit of measure. The course is measured and the bicycle is calibrated again. The course distance is calculated based on the number of counts recorded on the course and the two sets of calibration rides. The Detweiller Park course was measured using a bicycle calibrated over the first 300 meters of the race course as measured by the steel taping crew. The calibrated bicycle method is used to measure almost all road racing courses in the United States and has been adopted my many other countries around the world. It is not quite as accurate as measuring with a steel tape, but is generally faster and easier. The only two methods recognized by USATF for measuring a course with anything other than a single straight line segment are the calibrated bicycle and steel tape. Measuring Wheel. A wheel that is usually mounted to a handle, and turns a counter that reads out in units of measure. The wheel is pulled or pushed around a course. Most high school cross-country courses are measured this way. While reasonably accurate on hard paved surfaces, a number of issues affect the accuracy of these devices on grass. They can be more accurate if calibrated, but most users simply accept the length shown on the counter. GPS: The course was measured with a Garmin 305 GPS mounted to a bicycle. Although more accurate GPS units are available, consumer grade GPS is generally accurate within 5 to 10 meters. GPS units calculate distance by connecting readings taken at regular intervals around the course. USATF’s experience with handheld GPS units is that they generally produce measurements between one and two percent long. This is most likely because GPS units connect readings taken along the route. Due to the limits of accuracy inherent to the device, some of these points may be on one side of the measured line, and some may be on the other.
The result is a zigzag line, which will naturally be longer than the straight line the device actually followed. Units mounted on a bicycle are generally more accurate than those carried by hand, possibly because they move faster, thus smoothing out the curves more gracefully. Bicycle mounted GPS units also may get better satellite reception because the satellite signals are not blocked by the runner carrying them. It should also be noted that consumer GPS models generally only read to the hundredth of a kilometer, or 10 meters. If greater accuracy is desired, they must be augmented with another measuring device capable of more accurate readings. Comparing the methods. Of the methods used, there is little doubt that the steel tape is the most accurate method. The calibrated bicycle is accurate but there can be issues with a bicycle calibrated on a hard surface such as asphalt or concrete that is used to measure a course on a softer surface such as grass. The calibrated bicycle should be more accurate than a measuring wheel because it is recalibrated no less often than for each day’s measurements and that calibration reflects the weight and riding style of the measurer. It will approach the accuracy of a steel tape if the calibration and measurement are both performed over a smooth, hard consistent surface. Measuring wheels also appear to lose accuracy when used over grass courses, especially if the surface is wet or uneven. The accuracy of GPS is unknown; test results have varied. A GPS is probably accurate enough to measure training runs, but not accurate enough to measure race courses. If a coach or race director is interested in an accurate measurement of his or her cross-country course, the safest way would be to measure it with a steel measuring tape.
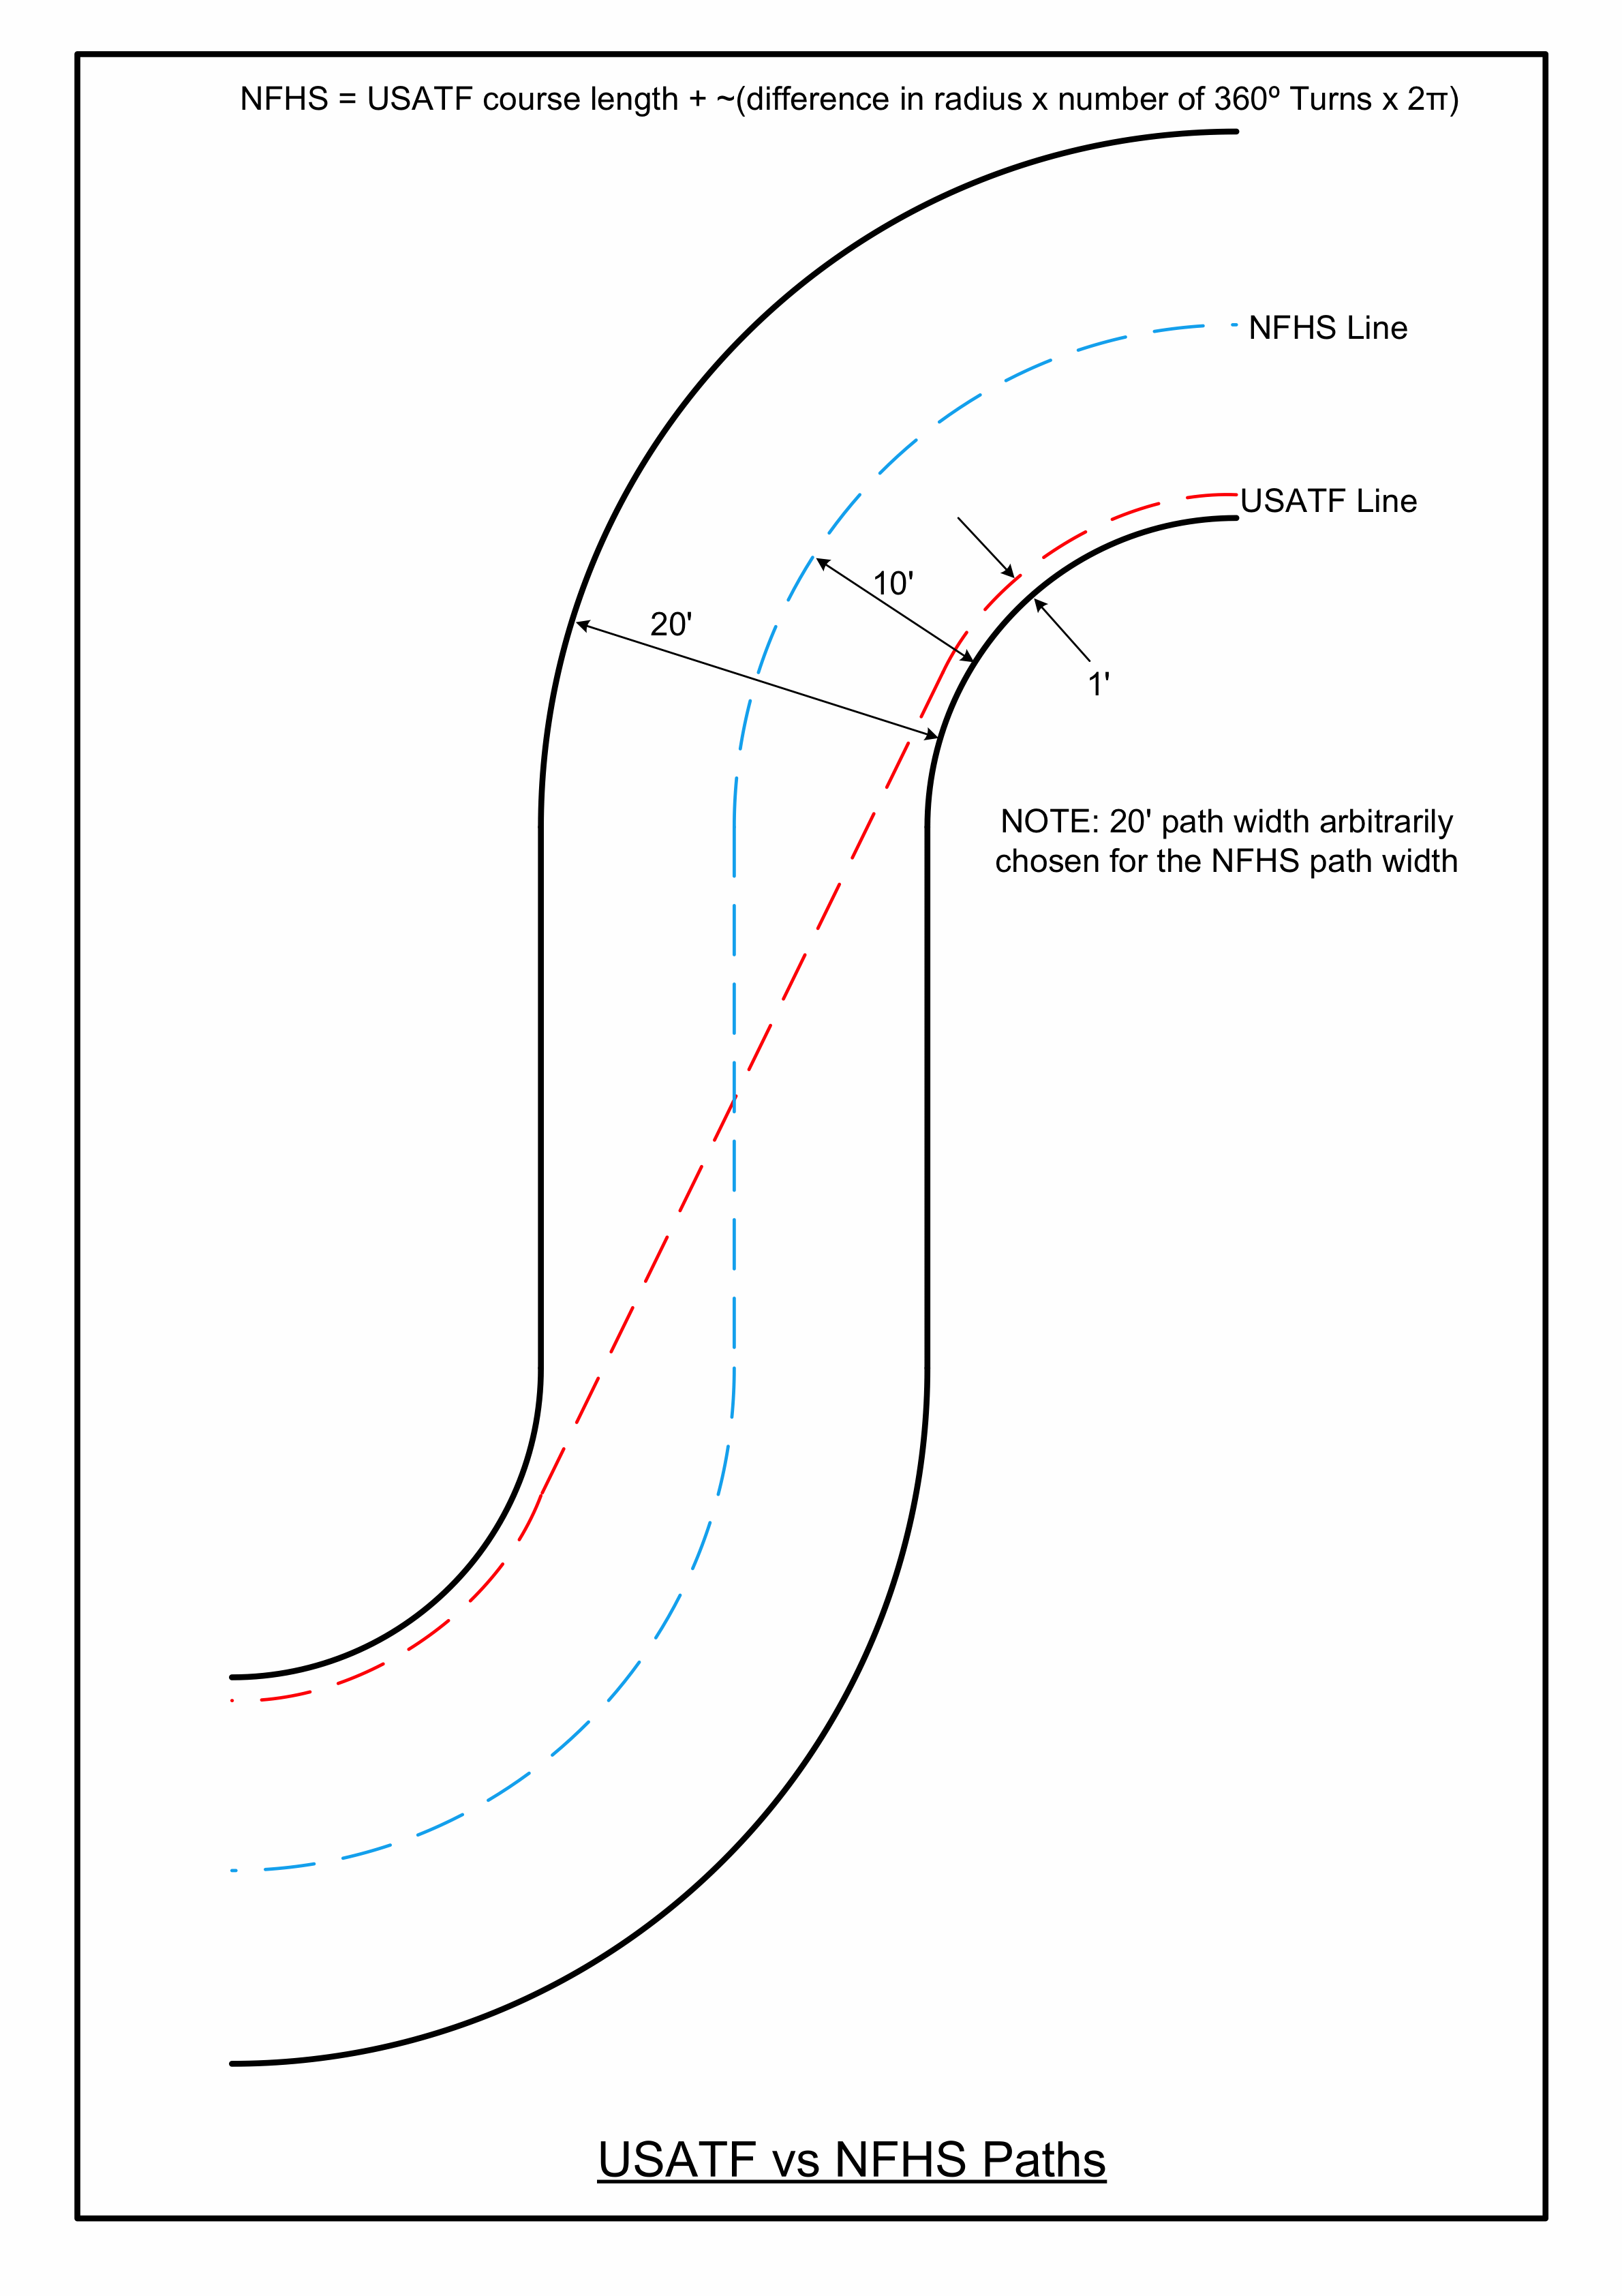
The USATF line and the NFHS line Both the current and historical Detweiller Park courses were measured along two different lines. An explanation of how the lines differ is in order. USA Track & Field (USATF), the governing body for Track & Field, Road Running, and Cross-Country, measures courses along the shortest possible route (SPR) that a participant can follow without cutting the course. This generally involves running on the inside of all curved sections of the course and connecting those curves with straight tangents which may parallel one side of the course or run diagonally across it. It should also be noted that the National Collegiate Athletic Association (NCAA) rules also require that cross-country courses be measured along this line. The method allows the measured path to be one foot or 30 cm out from the object (such as a tree or curb) that defines the course. This is consistent with the way USATF measures tracks; the measured line around lane one of a curbed track is 30 cm out from the outside edge of the curb. The National Federation of State High School Associations (NFHS) rules state that courses shall be measured “along the center”. The rules do not state the maximum width for a course nor do they state a width to be assumed when, like on segments of the Detweiller course, one side of the course opens into a large field. The IHSA, as a member of NFHS, is obligated to measure the course along the NFHS line. The following diagram depicts the difference between the two lines through a course segment with consecutive left and right turns. The formula shown is an approximate formula because it ignores the difference in length in the straight section between the two curves, which will be slightly longer on the USATF line than on the NFHS line. In practice, however, if the straight sections of the course are at all long, the difference between the two lines on the straight sections is negligible. If one assumes a 400-meter straight section 6 meters wide, the diagonal line through the section is about 0.045 meters longer- about 1.77 inches.
Figure 13: Path Line Diagram An example of how the length of a course might differ when measured along different lines is the course at Busse Woods Forest Preserve in Schaumburg that was used for the IHSA Schaumburg Sectional in 2007. Unlike many cross-country courses, this course is set up with painted lines that define both edges of the course, so it is relatively easy to establish both the USATF and NFHS lines around it. When measured last fall with a calibrated bicycle, the course measured 4811 meters along the USATF line but 4942 meters along the NFHS line. At 5.5 meters per second (a 4:53 mile pace), the difference between the two lines is 24 seconds over the length of the course. If tracks were measured the same way that cross-country courses are, a 400-meter track with two 100-meter curves and two 100-meter straights would measure 400 meters under USATF rules. However if the track were measured according to NFHS rules for measuring cross-country courses, it would be measured down the center of the track. If the track had six lanes, it would be measured down the inside line of lane 4. If the track had eight lanes, it would be measured down the inside line of lane 5. Assuming the lanes were one meter wide, the official distance around the track would be 418.84 meters on the 6 lane track and 425.12 meters on the 8 lane track. And a runner could run 400 meters in lane 1 and not be cutting the course. In most places, the course at Detweiller Park is at least 20 feet or 6 meters wide. We walked the course, observed the width of the course over its length, and arbitrarily chose to assume a 20-foot width. We thus measured the NFHS line 10 feet out from the landmarks that define the course. We measured down the center of the width available to the participants in the few places where the course was less than 20 feet wide.
Frequently Anticipated Questions (FAQ) Q: Why is this important? A: This is the most important high school cross-country course in the state of Illinois. Besides the State Final, it hosts at least three large invitational meets earlier in the season. The quality of cross-country in the state is evaluated based on performances on this course. The course has a reputation of being short, and performances on it are discounted for that reason. This costs Illinois athletes deserved national recognition - and possibly some attention from college coaches. Q: When USATF measures a course with a calibrated bicycle, don’t they add some distance just to make sure the course isn’t short? A: When a new course is laid out, USATF requires that a Short Course Prevention Factor (SCPF) of 0.1% (one meter per kilometer) be added to the course to insure that it isn’t short. However, when measuring an existing course to determine its actual length (for example when a record appears to have been set), the SCPF is not used, and it was not used in the measurement of the Detweiller Park courses. Q: When measuring with a steel tape, aren’t you supposed to correct for temperature? A: You are. However the correction is rather small, especially when measuring on a hot day like July 19 was. Assuming a temperature of 86 degrees Fahrenheit or 30 degrees Celsius, the correction works out to about 4 millimeters over a 50 meter tape length- or about 40 centimeters over a 4800 meter course. Q: It is generally accepted that the “new course” is about 9 seconds slower than the “old course”. Is there a reason for that? A: Our data does not show this. The pre-2003 and post-2004 courses are approximately the same length. In fact, some of the changes to the course would tend to make the current course faster than the 2002 course. The start and finish aren’t as far up the hill, which essentially makes the course flatter. And the changes also smoothed out some of the turns, especially in the north loop, which should also facilitate faster times. Our preliminary data on the 2003-2004 course shows that it was about 20 meters (0.0125 miles) longer than the course that came before or after, or 3.5+ seconds slower. Q: Didn’t the first turn used to be defined by some trees? A: It did. Before the 2006 race, however, the trees were cut down and new trees were planted south of the former location of the old trees. The IHSA apparently had the Peoria Park District fabricate some poles and placed them in sleeves in the ground in the location of the old trees. The course in the first turn is now defined by those three poles. The sleeves are set in concrete, and are not hard to locate if you know about where they are. We were able to find them easily on July 19. Q: Could the course have changed from 1972 to 2002? A: Absolutely. Most of the landmarks that define the course are trees. The trees (especially the evergreens) are larger at their base than they were in 1972. There are trees in the 2002 aerial photograph that aren’t there now. There are trees that define the course that definitely appear to be less than 35 years old. For the sake of discussion, if, due to tree growth, the radius of all of the turns on the course increased by 1 foot from 1972 to 2002, the overall length of the course would have increased by over 9 meters. That’s between one and two seconds for almost all of the runners who run in the State Final. Q: For years, coaches have been wheeling this course, and they’ve almost always found that it’s short. Are they all wrong? A: Not necessarily. If you measure this course over the shortest possible route a runner can run, it is indeed short of three miles. There are issues with the wheel as a measurement device, especially on grass, and there are differences between the line that most coaches “wheel” and the line the IHSA chose to measure. Most of those would tend to make the course measure shorter than it actually is. Q: Why isn’t there more data on the 2003-2004 course?
A: There is more history on the 2002 and prior course, and the 2005 to present course is memorialized with monuments at Detweiller Park at the start, finish, every half mile, and at those places where natural landmarks do not define the course. There is much less available documentation about how the course was laid out in 2003 and 2004. We believe that, except for the fact that there was only one creek crossing instead of two, the course was the same as it has been since 2005. But either the start or finish could have been moved in 2005 to its current location, and any physical evidence of the change would no longer be there. Or, NFHS rules being what they are, the IHSA simply could have defined the course as being a few feet wider in 2005, in which case it would be the same distance as it was in 2004. Q: So, did Chris Derrick and/or Craig Virgin run a full three miles? A: It’s hard to say for sure, but most likely neither did. Someone running far enough ahead that he or she sets a course record probably isn’t running in a pack after the half mile mark and has his or her choice of lines. It’s doubtful that they would have consistently run a radius on the corners large enough to approach the line that would be necessary to make this a full three-mile course. Q: Who ran faster, Derrick or Virgin? A: Your guess is as good as ours. The data shows the courses to be about the same length, and one definitely can’t conclude that the course was significantly longer or shorter in 2007 than it was in 1972. Appendix: Measurement Data Steel Taping data COURSE LENGTH (measured by steel tape* ) Shortest Route Course is 4788.88 m or 2.975 mi from marked start to finish line (see diagram or 128’5” / 39.15 m short of 3 miles if run on shortest route. Center of Course Course is 4864.24 m or 3.022 mi from marked start to finish line (see diagram) or 118’ 10”/ 36.21 m longer than 3 miles if run on center line of course MILE MARKS Shortest Route The first mile is (and should be relocated to) 34’ beyond the 1st mile pipe (current course if run on the shortest route is 34’ short of a mile at that pipe) The second mile is (and should be relocated to) 92’5” beyond the 2nd mile pipe (current course if run on the shortest route is 92’5” short of 2 miles at that pipe) Center of Course The first mile, if run on center line, is 24’4’’ short of 1st mile pipe (current course if run on center route is 24’4” longer than a mile at that pipe) The second mile, if run on center line, is 85’ short of 2nd mile pipe (current course if run on center route is 85’ longer than 2 miles at that pipe) * using ON COURSE RATING SYSTEMS®, OCRS, (patent pending) standardized course measurement method. See www.oncourseratingsystems.com Calibrated Bicycle Measurement Data 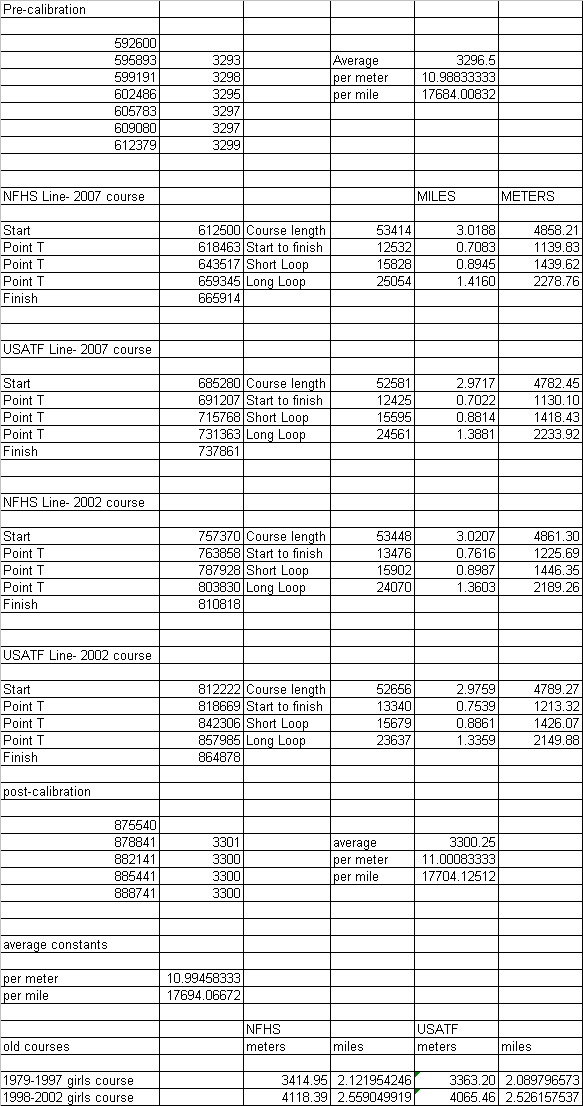
Other Measurement Data: Length of other historical courses (calibrated bicycle method- compiled from loop length data) | Course | NFHS length | USATF length | |
| Meters | Miles | Meters | Miles | | 1979-1997 Girls Course (2.1 miles) | 3414.95 | 2.1220 | 3363.20 | 2.0898 | | 1998-2001 Girls Course (2.5 miles) | 4118.39 | 2.5590 | 4065.46 | 2.5262 | Effect of the changes in the 3 mile course, from 2002 to 2007 (USATF line) | Loop | Description of change | Effect (meters) | | F | Start moved north | -47.1 | | F | Cone/Flag eliminated | -7.6 | | F | Finish moved north | -28.5 | | S | Cone/Flag eliminated | -7.6 | | L | Entrance to north loop changed | +19.3 | | L | Course reconfigured in north loop | +76.0 | | L | Cone/Flag eliminated | -7.6 | |
| TOTAL | -3.1 |
The Measurement Team 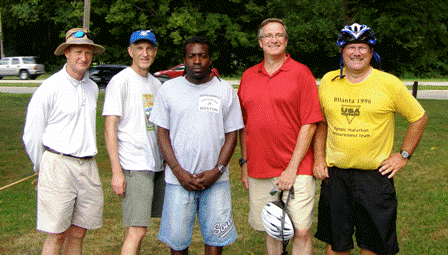
From left to right: John Tucker, Roger Koehler, Tony Jones, Gary Finley, Jay Wight John Tucker is the Head Cross-Country Coach at Washington & Lee University in Lexington, Virginia and the founder of On Course Rating Systems (OCRS). He has significant experience measuring cross-country courses with steel tapes. Roger Koehler is an accomplished Masters Runner and OCRS volunteer course measurer/instructor as well as a retired businessman and investor. He wanted to do this badly enough to put up with John all the way from Virginia to Peoria and back. Tony Jones is currently the co-publisher of DyeStatIL.com, which is the successor to Illinois Prep Top Times, the journal of high school cross-country and track in the state. He is a former high school and college track and cross-country runner. Gary Finley is a former Illinois high school track and cross-country runner who was inspired to do this due to the uncertainty surrounding the course record last fall. He holds a Bachelor of Science in Electrical Engineering from the University of Illinois. Jay Wight is also a former Illinois high school cross-country and track runner and serves as the USATF certifier for the state of Illinois. He has personally measured over 300 road race courses by calibrated bicycle, including the Bank of America Chicago Marathon. |